Executive Summary
History shows economic cycles always have two parts: the bull and bear phases. In a little over the last twenty years alone, two economic cycles have demonstrated this fact. For investors, the bull phase is not the only important piece of the cycle. Long-term returns are determined by how detrimental the bear phase is. When the stock market bull phase becomes extremely detached from the underlying corporate profits, the visual is similar to the jaws of an alligator opening widely. Risk to investors becomes high at this point. Risk happens slowly…then all at once, according to Keith McCullough of Hedge Risk Management. The bear phase often happens quickly and with great force as the jaws snap shut. When the bear phase ensues, history shows it is not guaranteed to bounce back rapidly. Should the current cycle have investors fearing the snap of the alligator’s jaws? Is this the riskiest stock market in history? Will the bear phase and subsequent “recovery” resemble Japan after 1989? Please proceed to The Details for more information.
“It’s not what you make, it’s what you keep.”
The Details
The key to full-cycle investing is to understand, it is not what your return is in a particular year that matters, it is how much you keep at the completion of the cycle. Often investors tend to focus on the calendar year to determine “success.” However, there are two phases to a market cycle, the bull phase followed by the bear phase. More important to long-term returns is not how much you earn in the bull phase, but how little you lose in the bear phase.
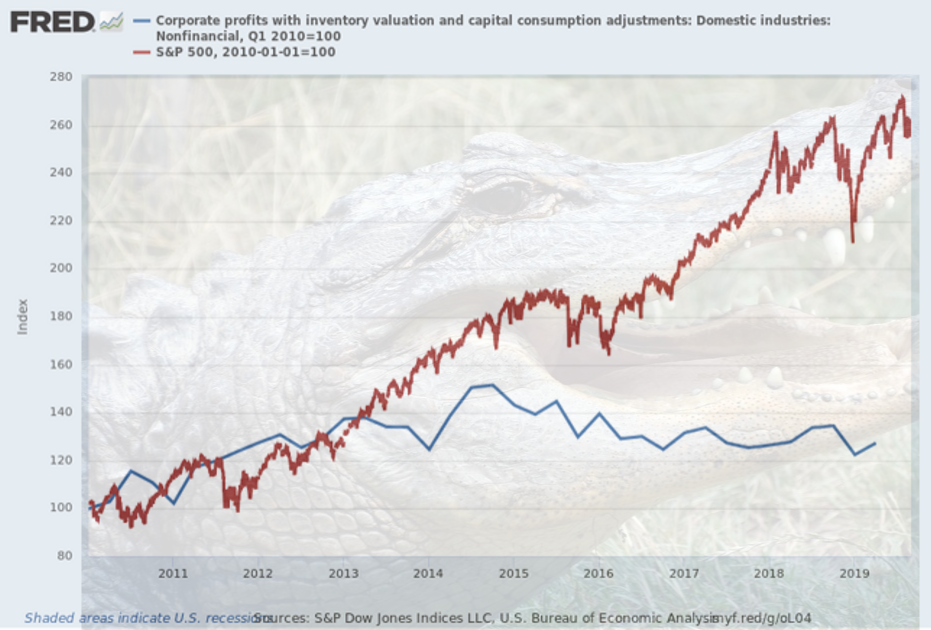
This confusion can be seen by examining the two-prior bull-bear cycles – the blue line in the graph below.

You can think of risk like the jaws of an alligator. When shut, they represent a stock market at its long-term average valuation. Slowly the alligator opens its mouth. The further open the more overvalued the market relative to earnings. At some point, despite all efforts to keep the alligator’s mouth open, it reaches its limit and eventually snaps shut. Bear markets tend to happen much quicker than bull markets. Keith McCullough, CEO of Hedgeye Risk Management, says it this way, “Risk happens slowly at first…then all at once.”
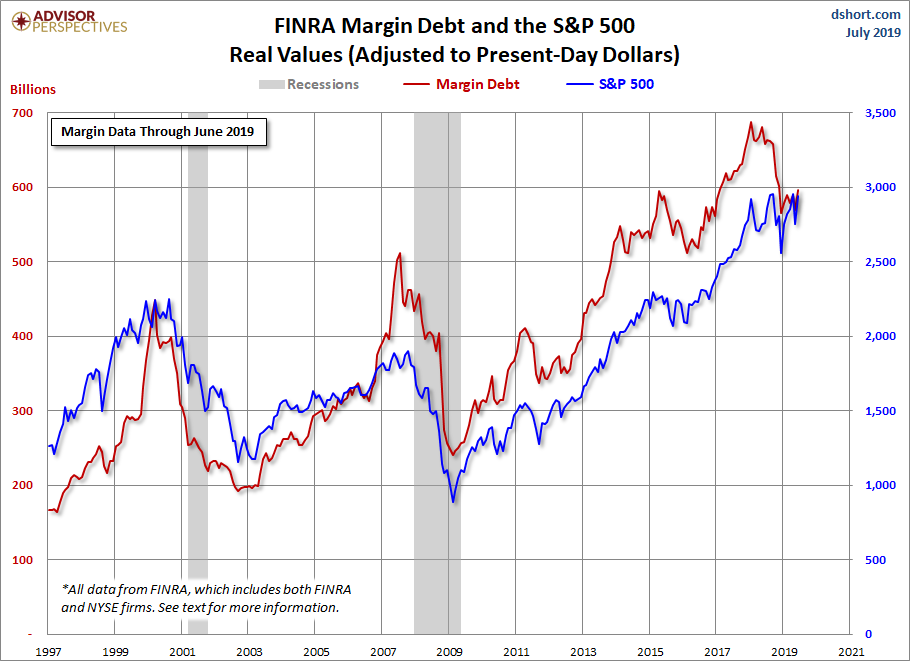
For years the market has been trending higher, albeit with a few hiccups along the way, not due to improving economic and corporate profit growth, but instead due to lack of alternatives with interest rates near record lows and massive liquidity fueled by central banks. This disconnect has led to enormous multiple expansion or paying more for stocks and getting less in profits. And this is despite corporate efforts to create the image of profit growth by borrowing funds to reduce the number of shares outstanding.

Economist David Rosenberg of Gluskin Sheff recently shared the following chart illustrating the continuous revisions to third quarter 2019 S&P 500 earnings. Yet, the market surged last week attempting to reach new highs. The fundamental factor which should impact the price of stocks is falling, yet again being ignored.

Additionally, the global economy is in a serious decline. Many European countries are experiencing near-recessionary growth. China just announced the slowest industrial production in 17 years, and U.S. GDP growth for third and fourth quarters 2019 are likely to show sub-2% real growth. In fact, after future revisions of current data arrive, it is very likely determined that a recession has already started. With debt levels pushing all-time highs, declining corporate profits, and weak-to-recessionary global economies, record-priced stocks present one of the riskiest environments in the history of the stock market. When the jaws snap shut, the damage will be real.
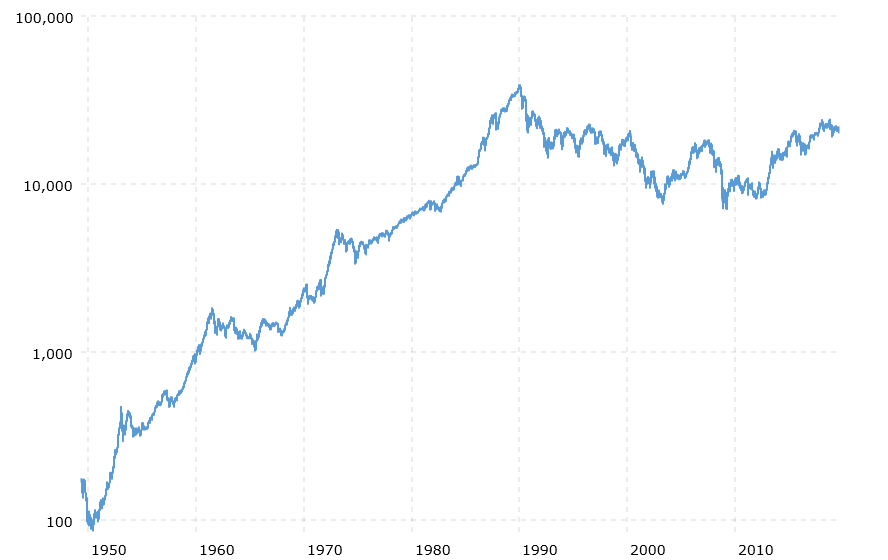
Most pundits today believe if the market “corrects,” central banks will step in and the market will quickly snap-back similar to after the Great Recession. However, that result is not guaranteed. The following chart of Japan’s Nikkei 225 stock index from Macrotrends shows the market has still not recovered from the sell-off that started in 1989 despite years of low-to-negative interest rates and quantitative easing, including the purchase of equity exchange-traded funds with printed money. What if such a slow recovery occurred in the U.S. after the next bear market?
Japan’s Nikkei 225 Index

Economist Dr. John Hussman wrote the following,
“It’s useful to remember that long-term returns represent not only trough-to-peak advances, but peak-to-trough resolutions as well. Buy-and-hold investors don’t get the trough-to-peak return. They get the full cycle return. Not surprisingly, the higher the valuation at the bull market peak, the longer the subsequent period of disappointing returns, in several instances extending more than a decade, though not without intermittent failure-prone bull market rallies to add excitement. This is what I often call ‘going nowhere in an interesting way.’”
Today the jaws of the alligator are wide open. Most fundamental data are screaming “warning,” yet most investors continue to base investment decisions on “hope.” Hope for a trade resolution with China. Hope the geopolitical risks in Hong Kong, Iran, North Korea, Saudi Arabia and others don’t impact the global economy. Hope that households can continue to add more debt to push more economic growth. Hope that massive debt levels don’t really matter to stock prices. Hope that a globe awash in negative-yielding debt won’t have harmful consequences.
Sven Henrich of Northman Trader recently tweeted an interesting comment,
“10 years after the financial crisis there is zero evidence that markets can make or sustain new highs without artificial intervention or stimulus of some sort. A giant subsidy program that has not produced above trend growth, but record debt expansion & wealth inequality.”
The current massive bubble in the stock market is being propped-up by non-fundamental factors. As with all bubbles, there is always a subsequent bear market. The extent of today’s market multiple expansion combined with falling earnings, weak global economies and record debt makes this possibly one of the riskiest bubbles of all time. When the jaws snap shut, will central banks be able to manipulate another artificial market ramp, or will the market remain low for an extended period of time alá Japan?
The S&P 500 Index closed at 3,007 up 0.96% for the week. The yield on the 10-year Treasury rose to 1.90%. Oil prices fell to $55 per barrel, and the national average price of gasoline according to AAA increased to $2.57 per gallon.
© 2019. This material was prepared by Bob Cremerius, CPA/PFS, of Prudent Financial, and does not necessarily represent the views of other presenting parties, nor their affiliates. This information should not be construed as investment, tax or legal advice. Past performance is not indicative of future performance. An index is unmanaged and one cannot invest directly in an index. Actual results, performance or achievements may differ materially from those expressed or implied. All information is believed to be from reliable sources; however we make no representation as to its completeness or accuracy.
Securities offered through First Heartland Capital, Inc., Member FINRA & SIPC. | Advisory Services offered through First Heartland Consultants, Inc. Prudent Financial is not affiliated with First Heartland Capital, Inc.
Want to learn more about our Insurance strategies?
Set up a time to chat with us.

