Executive Summary
You may have heard the expression: “a picture is worth a thousand words”. Weekly I write much about the economy and the markets. This week I am taking a que from the above quote. Please take a look below at the charts and graphs with very brief explanations. Feel free to draw your own conclusions.
“Get your facts first, then you can distort them as you please.”
— Mark Twain
The Details
In the run-up to an election year in truly hyper-partisan times, it can be difficult to assess the actual status of the economy. For one reason or another, the messages seem to be diametrically opposed. In order to shed some light on the subject and let you form your own conclusion; I am presenting a series of charts and graphs designed to put “soundbites” into perspective. I will provide a few tidbits of information about some of the data, otherwise, you are free to interpret as you see fit.
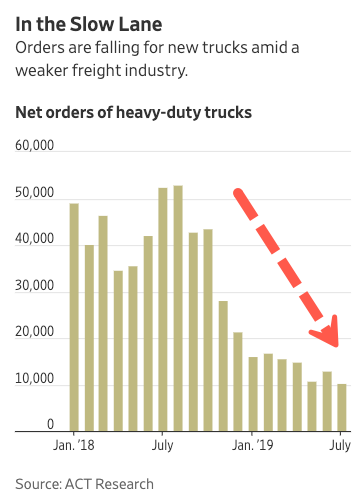
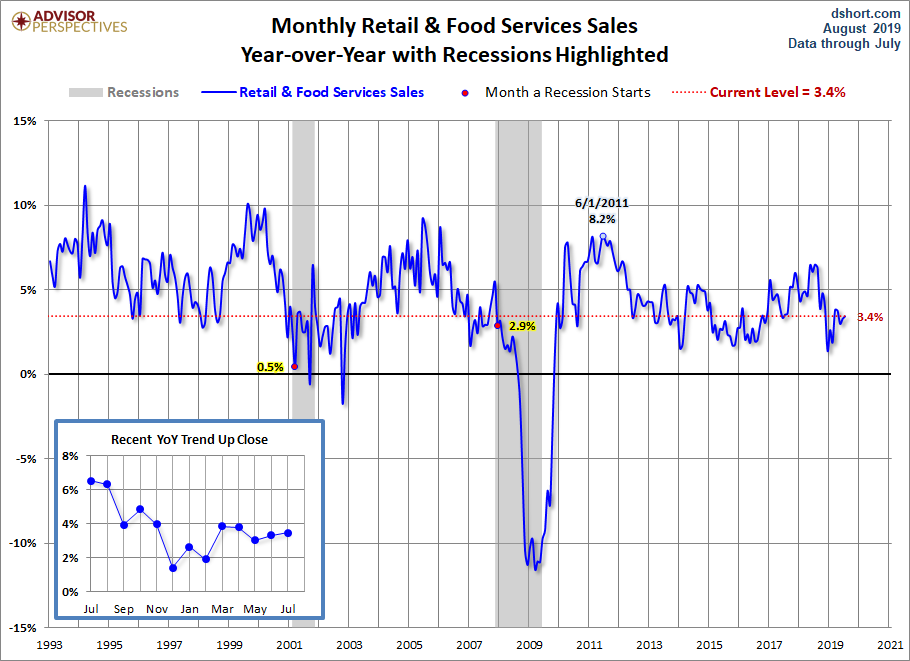
The areas examined below include: Auto and light truck sales (shown with population growth of almost 48 million since 2000, in green); heavy truck orders; existing home sales year-over-year and monthly changes adjusted for population growth; retail and food services sales; consumer debt (used for retail and food services sales) compared to GDP growth; manufacturing activity as seen through the composite PMI (Purchasing Managers Index); and finally, non-farm payroll growth versus growth in hourly earnings.
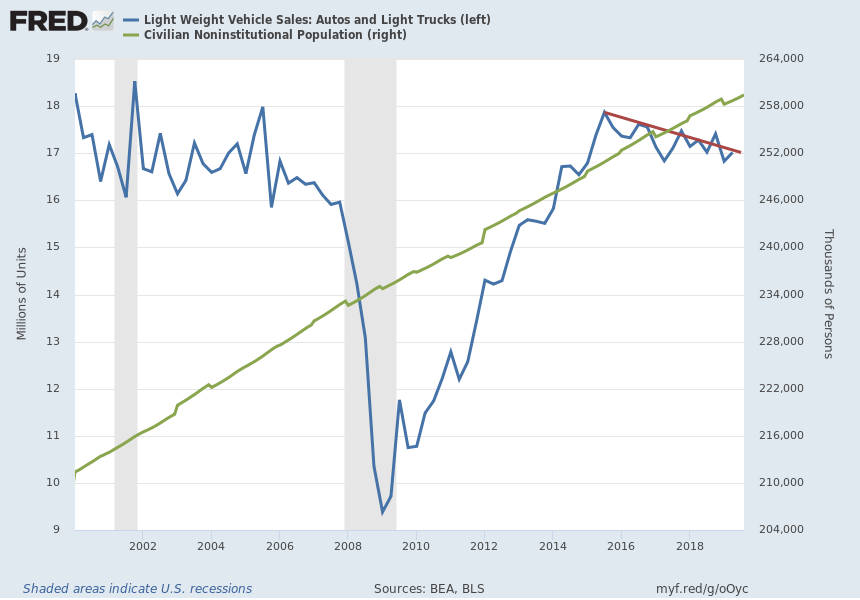
According to an article on Zero Hedge, “For the first half of the year, vehicle deliveries fell 2.4% to 8.4 million vehicles. This puts the pace for new vehicle sales on track to fall below 17 million for the year, which would be the worst level since 2014. Further, it has lowered estimates for the full year to 16.95 million units delivered, on par with a ‘horribly mature market’ in 1999.”
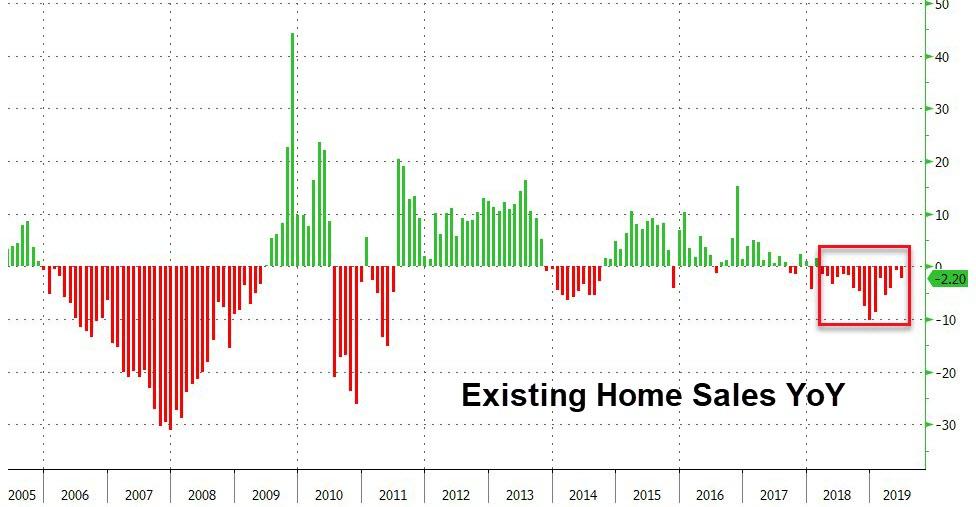
July was the sixteenth consecutive month of year-over-year declines in existing home sales.
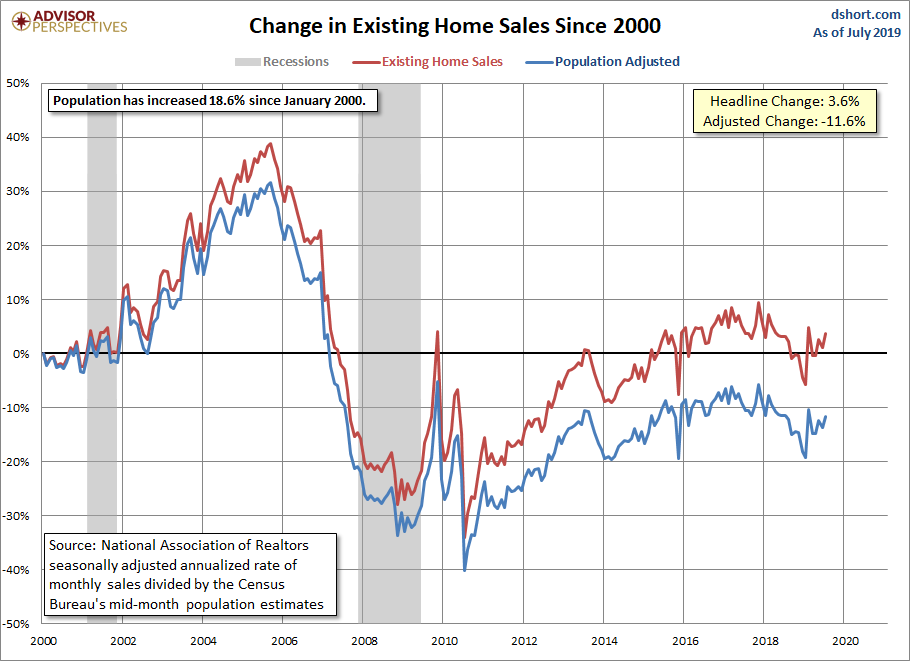
In the graph below, notice that existing home sales on a population-adjusted basis remain 11.6% below the level in 2000.
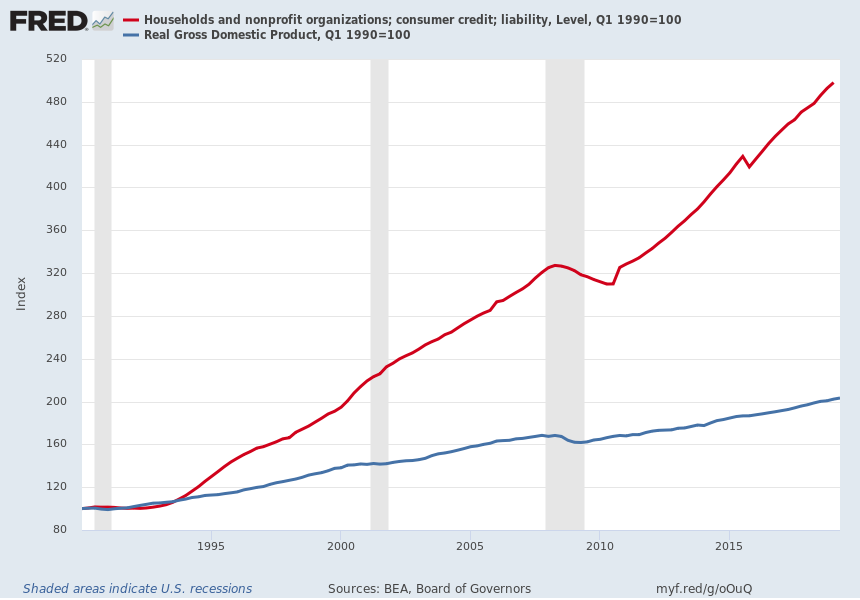
The graph below illustrates the impetus for retail sales growth – the explosion in consumer credit. The current level is 53% higher than the balance just prior to the last recession. The blue line shows the rate of growth in GDP versus the extreme rate of growth in the consumer debt. This relationship is unsustainable.
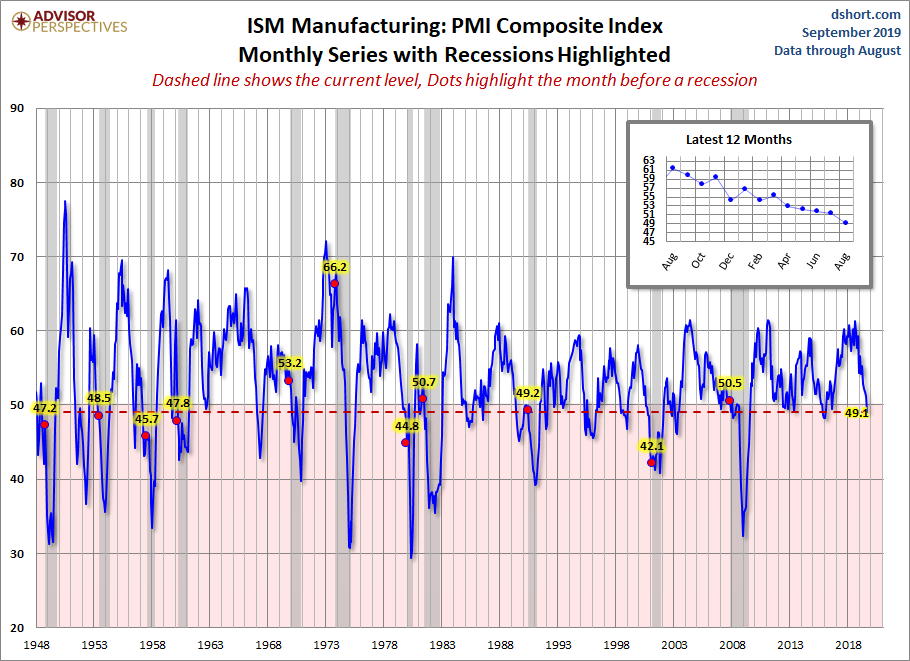
ISM PMI readings below 50 indicate contraction. Current manufacturing levels are slightly contractionary. Notice in the smaller graph, the 12-month trend is downward.
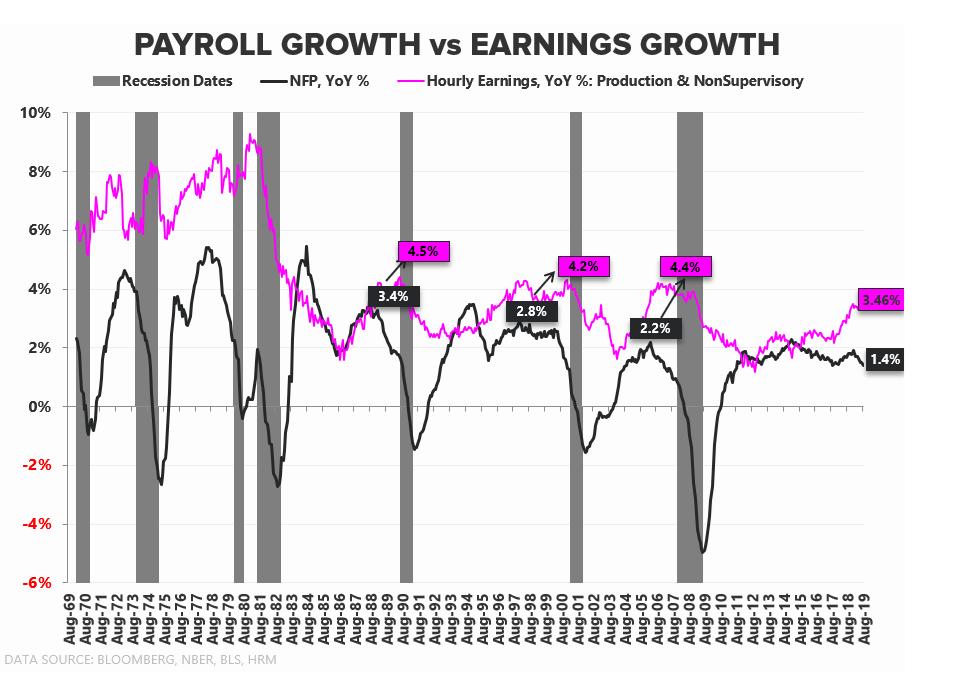
Falling payroll growth and rising hourly earnings preceded almost all prior recessions.
Currently, both the New York Fed’s Nowcast model and the Atlanta Fed’s GDPNow model are predicting approximately 1.5% real economic growth for the third quarter 2019.
After reviewing the above data, hopefully you can see a clearer picture of the current economic trends, along with the impetus (debt) required to achieve these results.
The S&P 500 Index closed at 2,979 up 1.8% for the week. The yield on the 10-year Treasury rose to 1.55%. Oil prices increased to $57 per barrel, and the national average price of gasoline according to AAA decreased to $2.56 per gallon.
© 2019. This material was prepared by Bob Cremerius, CPA/PFS, of Prudent Financial, and does not necessarily represent the views of other presenting parties, nor their affiliates. This information should not be construed as investment, tax or legal advice. Past performance is not indicative of future performance. An index is unmanaged and one cannot invest directly in an index. Actual results, performance or achievements may differ materially from those expressed or implied. All information is believed to be from reliable sources; however we make no representation as to its completeness or accuracy.
Securities offered through First Heartland Capital, Inc., Member FINRA & SIPC. | Advisory Services offered through First Heartland Consultants, Inc. Prudent Financial is not affiliated with First Heartland Capital, Inc.
Want to learn more about our Insurance strategies?
Set up a time to chat with us.

