Executive Summary
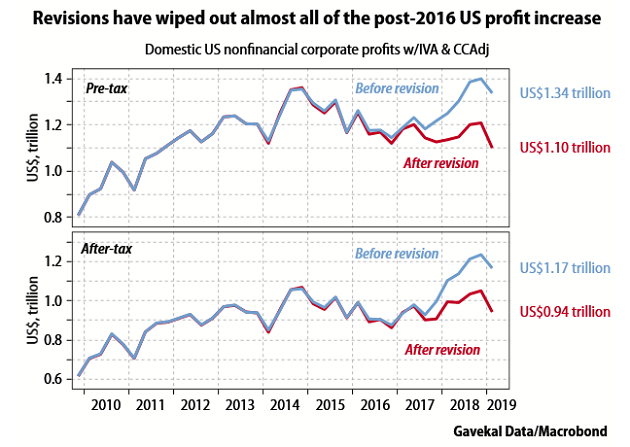
Recent stock market volatility has been impacted by headlines and tweets about trade wars and tariffs. However, digging deeper into the real data indicates the economy is approaching the end of its cycle. The temporarily juiced profits from the corporate tax cuts have evaporated. The Commerce department recently released data revising corporate profits downward. This further exacerbates the gap between stock prices and corporate profits, which also increases risk and volatility. All of which has been playing out with huge daily and weekly swings in the market due to algorithmic responses to headlines and tweets. In the end, the market cycle and fundamentals will be proven correct. Please proceed to The Details for supporting graphs and the complete narrative.
“Beware of false knowledge; it is more dangerous than ignorance.”
— George Bernard Shaw
The Details
As the global economy drifts closer to recession, and currency wars and tariffs impact trade, the gap between declining corporate profits and stock prices widens. With little ammo to juice profits as done by the corporate tax cuts in 2018, it will become harder to justify near record high stock price valuations. Thanks to Twitter, some have learned that mere tweets about progress in trade negotiations, whether accurate or not, is all it takes to initiate the algorithm buy-programs. This adds to the increased volatility and risk in markets now approaching the end of the cycle.
Recently the Commerce department released a revision to National Accounts data. This revision had a significant effect on corporate profits. Notice in the chart below prepared by Gavekal Research, the huge bump in pre-tax profits post the 2016 election has largely disappeared. Additionally, while the tax cuts boosted after-tax profits beginning in 2018, even they are under pressure.

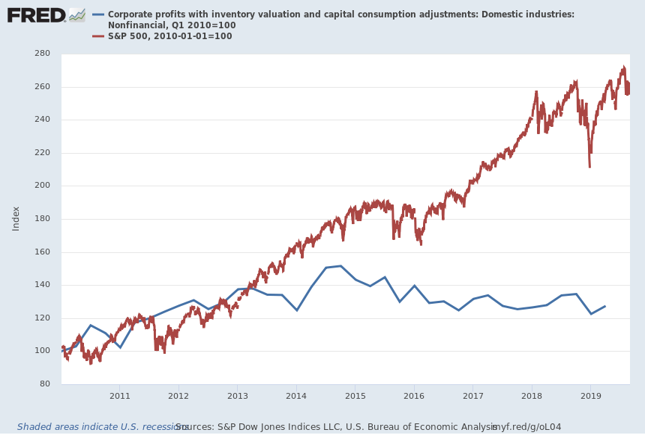
The following graph prepared using the St. Louis Fed FRED database, illustrates the widening gap (higher P/E ratios) between stock prices and profits.

Uncertainty surrounding government policy is making it difficult for businesses to adequately plan for the future. Patrick Wilson, Senior Analyst at Mauldin Economics, recently wrote (emphasis mine):
“That, I believe, is the main reason business profits aren’t growing. Boards have gone into survival mode — just trying to hold what they have and using buybacks to create the illusion of growth.
This has consequences for everyone, most immediately the workers who will lose their jobs when recession strikes. But investors will lose, too.
US public companies are $12 trillion more valuable than they were when Trump was elected. They are not $12 trillion more profitable. Share prices are up because investors are paying higher prices (P/E ratios) for the same ‘goods,’ i.e. earnings.”
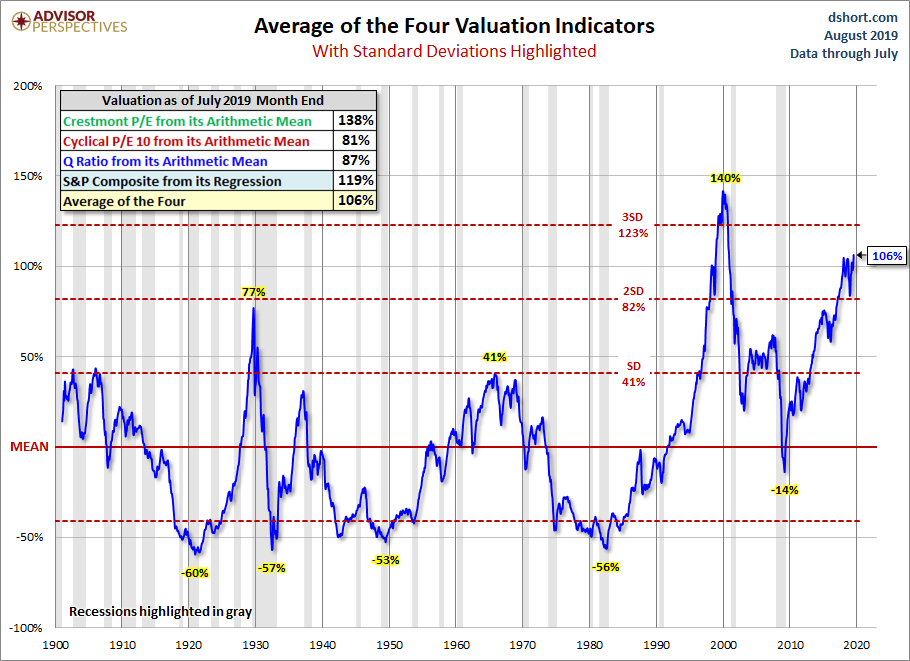
Examining how wide the gap from fundamentals has grown, the chart below from Advisor Perspectives illustrates the average of four different valuation methodologies. These individually indicate the market is overvalued somewhere between 81% and 138%. That would imply the S&P 500 Index would need to fall between 45% and 58% merely to reach the long-term average valuation level.

As the mirage of solid profit growth fades and a strong possibility of a near-term recession appears, what is left to maintain current extremely lofty stock prices? Will a new experimental monetary program be implemented to boost stocks? Or will it be a never-ending stream of unsupported tweets?
And, though it is important to remain apolitical when analyzing economic and market data, the President has taken “ownership” of the stock market. And thus, as an election year approaches, it appears the market will become a political tool. For investors, it is important to distinguish, as hard has it can be sometimes, real economic data from false stock-boosting blather. In the end the market cycle and fundamentals will be proven correct. However, in the short-run, program trading, 24/7 media coverage, and tweets, could proffer a dramatic increase in volatility.
Revised corporate profit data is signaling a warning to massively overvalued markets. It might take a resolution to the U.S. China trade war to give the market a temporary boost. Yet, even in that unlikely event, the real economic data is signaling end of cycle. A brief extension could be provided with a China deal, but don’t be fooled by false claims.
The S&P 500 Index closed at 2,926 up 2.79% for the week. The yield on the 10-year Treasury fell to 1.50%. Oil prices rose to $55 per barrel, and the national average price of gasoline according to AAA decreased to $2.58 per gallon.
© 2019. This material was prepared by Bob Cremerius, CPA/PFS, of Cremerius Wealth Management, and does not necessarily represent the views of other presenting parties, nor their affiliates. This information should not be construed as investment, tax or legal advice. Past performance is not indicative of future performance. An index is unmanaged and one cannot invest directly in an index. Actual results, performance or achievements may differ materially from those expressed or implied. All information is believed to be from reliable sources; however we make no representation as to its completeness or accuracy.
Securities offered through First Heartland Capital, Inc., Member FINRA & SIPC. | Advisory Services offered through First Heartland Consultants, Inc. Cremerius Wealth Management is not affiliated with First Heartland Capital, Inc.
Want to learn more about our Insurance strategies?
Set up a time to chat with us.

