Executive Summary
What is an inverted yield curve, and what is the significance on the economy? A normal yield curve shows shorter-term bonds pay a lower interest rate than longer-term bonds. The graphic slopes upward from left to right. An inverted yield curve is the opposite and depicts shorter-term bonds yielding more than the longer-term bonds. The normal curve represents investors’ demand for higher interest rates to compensate for the added risk of longer-term maturities. Historically, when the yield curve has inverted, a recession followed; however, usually it is a symptom of the economy, not a cause of recession. For the complete explanation, graphs and quotes regarding the economy and future interest rates, please proceed to The Details.
“It isn’t that they can’t see the solution. It is that they can’t see the problem.”
— G.K. Chesterton
The Details
Over the past two weeks, I have written about the global plunge into negative nominal interest rates. In the meantime, the U.S. 10-year Treasury rate has plummeted to 1.54% as of Monday, August 26. Although the Federal government utilizes several different measures of inflation, the Consumer Price Index (CPI) is probably the most widely recognized. The CPI is currently about 1.8%. Therefore, although nominal (before inflation) interest rates in the U.S. might be slightly positive, the real (inflation-adjusted) rate is negative by close to a quarter of a percent. It seems on a “real” basis, the U.S. has joined the party.
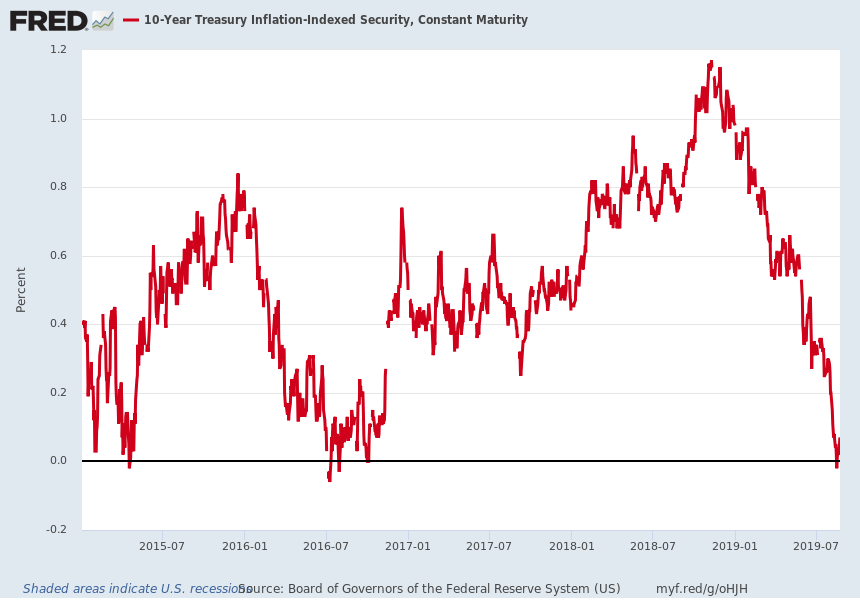
Another way to examine the “real” interest rate on 10-year Treasury Notes is to look at the 10-year TIP security rate or Treasury Inflation-Protected security. As of today, Monday, August 26, the 10-year TIP security rate was 0.00% according to the U.S. Department of the Treasury. That means after inflation the current yield would merely return one’s principal. And last Friday the TIP security rate was negative. See the chart below from the St. Louis Fed FRED database illustrating the plunge in real 10-year Treasury rates.

Another phenomenon all over the media lately is the inverted yield curve. The yield curve is a graphical representation of interest rates across the maturity spectrum. In a normal healthy economic environment, interest rates on short-term debt instruments are lower than interest rates on long-term bonds. Longer-term bonds are subject to wider fluctuations in value as interest rates rise and fall over the term of the bond. Investors or lenders typically demand higher interest rates to compensate for the added risk resulting from extended maturities.
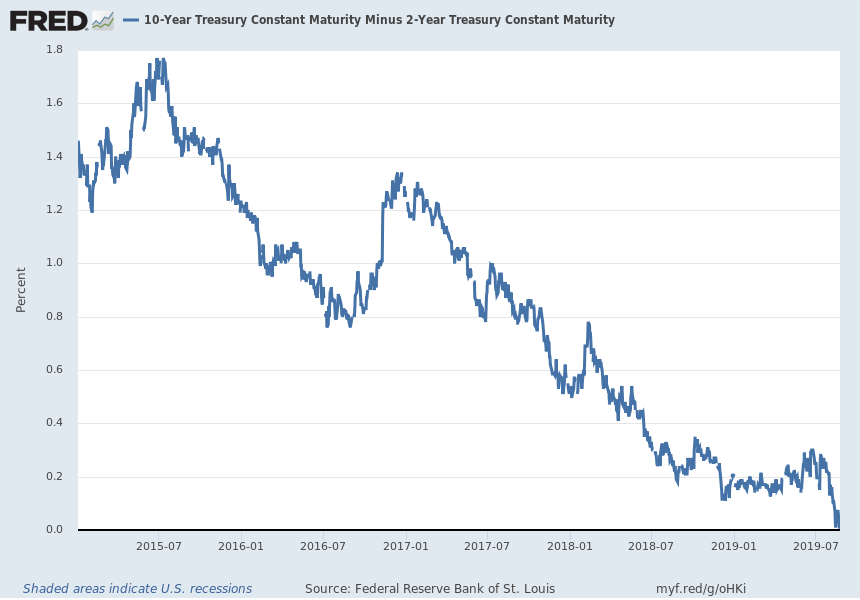
The following chart illustrates the difference between the 10-year and 2-year Treasury rate. The 2-year rate closed slightly higher than the 10-year rate today. This is called an inverted yield curve. Historically, an inverted yield curve has been a precursor for a recession, thus the focus on recent inversions.

Economist Dr. Lacy Hunt of Hoisington Investment Management wrote in his June 30, 2019 newsletter about the frequency of recessions post inversion. Using the 3-month rate for the short-term indicator and 10-year or longer rates for the long-term indicator, he stated these rates had just inverted for the eleventh 11 time since 1921. He continued,
“In all previous ten inversions, recessions followed. In seven cases, flattening, not inversion, was a sufficient condition for recession. The current inversion is the eighteenth cyclical flattening since 1921, with all of the prior seventeen preceding recessions, as officially recognized by the National Bureau of Economic Research [NBER]…the curve has historically begun to steepen at the start of recessions as the Fed lowers the policy rate. This is an important point. If the Fed does not ease in a timely fashion, monetary restraint will intensify and the degree of curve inversion will also increase. A late response from the Fed, which we are now experiencing, risks worsening the recession in both magnitude and duration.”
Many economic indicators are beginning to flash warning signs. Usually, current data is subsequently revised downward revealing the existence of a recession. That is why it often takes the NBER up to a year following the start of a recession to officially declare the start date.
One of the main components in recession dating surrounds manufacturing activity. The following was reported by CNBC last week,
• The U.S. manufacturing PMI (purchasing managers index) was 49.9 in August, below the neutral 50.0 threshold for the first time since September 2009, according to IHS Markit.
• New orders received by manufacturers dropped the most in 10 years, while the data also showed export sales tanked to the lowest level since August 2009, the data shows.
Slowing economic growth combined with exorbitant debt levels are responsible for the falling long-term interest rates. The inverted yield curve is a symptom of the problem, not a cause of the problem. Dr. Hunt stated,
“With the current global experience of more than two decades of subnormal economic growth in the face of extreme over-indebtedness, numerous cases of sustained historically low levels of real yields have come into focus and the…analysis indicates this recent pattern is likely to persist. If debt levels as a percentage of total output continue higher, then investors will likely face even lower future real yields.”
Absent a drastic change in approach to debt and monetary policy, it appears lower yields will persist.
The S&P 500 Index closed at 2,847 down 1.44% for the week. The yield on the 10-year Treasury fell to 1.52%. Oil prices dropped to $54 per barrel, and the national average price of gasoline according to AAA decreased to $2.59 per gallon.
Want to learn more about our Insurance strategies?
Set up a time to chat with us.

