Executive Summary
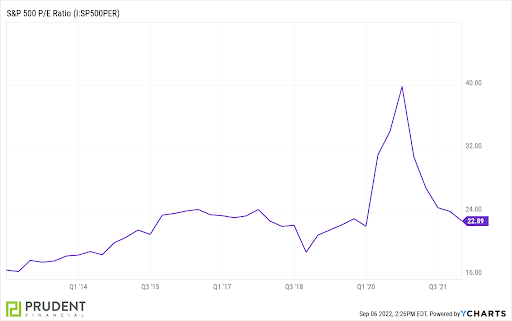
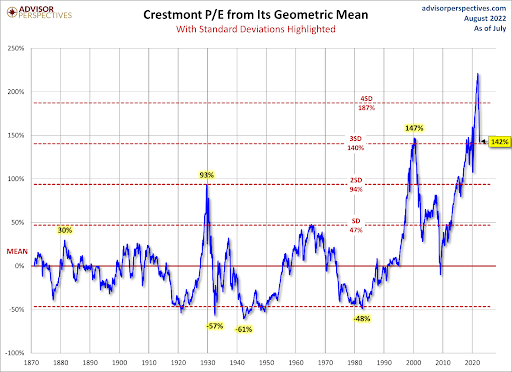
One indicator for determining stock market valuation is the Price-to-Earnings ratio (P/E). In this missive, I explain how the math (increases/decreases in numerator and denominator) impacts the ratio in changing market cycles. Generally, if price rises and earnings remain the same the ratio increases, and when price falls and earnings remain the same, the ratio decreases. The first graph shows how the ratio reacted to drastic changes in price and earnings during the pandemic. Note, even with market decreases this year, the overall valuation is still three standard deviations above the mean (second graph). And, while prices have dropped, the corresponding drop in earnings (denominator) has not occurred yet. The recent surge in inflation – both the PPI (Producer Price Index) and CPI (Consumer Price Index) will negatively impact corporate earnings as corporations have not been able to pass through the increase in their costs to consumers. Thus, earnings are overstated, making stock valuation ratios misleading.
Please proceed to The Details.
“The only thing you should do with pro forma earnings is ignore them.”
–Benjamin Graham
The Details
One of the most common indicators for determining stock market valuation is the Price-to-Earnings ratio (P/E). There are many derivations of the P/E including: Forward P/E, Trailing Twelve Month P/E (TTM), Operating P/E, Cyclically Adjusted P/E (CAPE) also called the P/E 10, and Adjusted P/E among others. The PE 10, sometimes referred to as the Shiller P/E, divides the price of the S&P 500 by inflation-adjusted 10-year average earnings. Using 10-year earnings reduces the impact of the business cycle. The oldest and most familiar ratio is the TTM P/E. This merely uses the prior 12 months net earnings for the denominator.
Examining the TTM P/E, the ratio can move up or down based upon the movement of two factors: the price of the S&P 500 and the prior 12 months’ earnings. If price rises and earnings remain the same, the ratio increases. If the price falls and earnings remain the same, the ratio decreases. If the price falls but earnings fall at a slower rate of change, the P/E will drop. Oftentimes at the beginning of bear markets, the price begins to fall while the impact to earnings has yet to hit. The result is the P/E ratio gives the impression that the market is less overvalued than it actually would be if earnings reflected the upcoming reduction. Typically, the economy is slowing as the market slides into a bear market. If economic growth is slowing, then corporate earnings should also fall.
As of the end of the first quarter 2022, the S&P 500 TTM P/E was 22.89 as shown below. The spike in the P/E shown in the graph is due to the combination of the brief drop in earnings during the pandemic, and the subsequent soaring of the stock market in response to the unprecedented stimulus plans. As the stimulus wore-off and monetary policy shifted to tightening, the stock market has fallen. So far, earnings do not reflect the upcoming slowdown in corporate profits. This gives the appearance that market valuations have declined to more reasonable levels. However, the “E” in the P/E below does not reflect the drop in earnings that is on the horizon. It becomes more difficult to gauge valuation using the TTM P/E as both price and earnings are plummeting.
Looking at the Crestmont P/E below, which is another derivation of the P/E 10, the stock market remains near the highest valuations of all times. By looking at 10-year average earnings, the short-term fluctuations have less impact on overall valuation levels.
It is normal for analysts to overestimate earnings expectations at the start of a cyclical slowdown. Notice in the graph below from economist Lance Roberts of Real Investment Advice, current projected earnings remain at the top of the channel (yellow circle, mine).
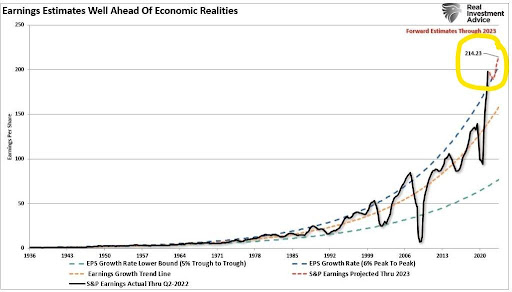
Yet as also illustrated by Lance Roberts, after a period of above-trend earnings and during subsequent bear markets, earnings fall below the long-term trend. The historical long-term trend is around 6% growth in earnings. Most deviations above the trend are due to some form of government stimulus or monetary policies, which temporarily boosted earnings and resulted in stock market bubbles. When the bubbles burst and the cycle turned downward, economic growth and earnings fell below the trend.
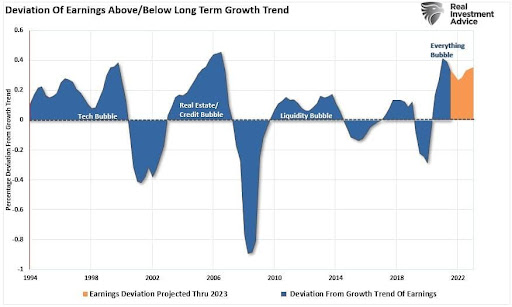
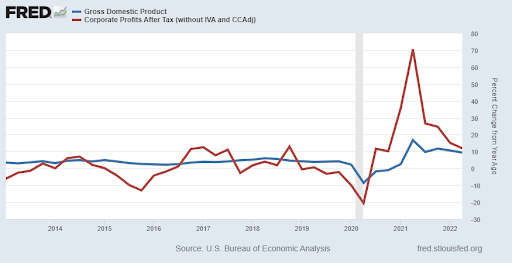
The trend in earnings is around 6% because over the long-term, nominal (before inflation) economic growth has approximated 6%. However, more recently, nominal growth has fallen short of the 6% trend. Therefore, the recent stimulus boosted earnings, now resting far above trend, are unsustainable. The post-pandemic surge in earnings was solely due to the massive amounts of Federal stimulus provided both to individuals and businesses. The graph below shows nominal GDP growth in blue and growth in corporate earnings in red. The spike and drop in earnings after the 2020 recession are due to Federal policies implemented during the pandemic.
The key to understanding the result of P/E calculations is realizing the status of corporate earnings. Do earnings reflect the impact of the current business cycle? Are profit margins over or understated? Presently, profit margins have been high. However, the recent surge in inflation – both the PPI (Producer Price Index) and CPI (Consumer Price Index) will impact corporate earnings. The PPI has been higher than the CPI indicating that corporations have not been able to pass through the increase in their costs to consumers. If so, earnings will soon reflect the reduction in profit margins.
As the economy slips into recession and the bear market rolls onward, the outlook for corporate earnings will be reduced. I expect significant downward revisions to projected profits both this year and next. Expected earnings are currently overstated.
The S&P 500 Index closed at 3,924, down 3.3% for the week. The yield on the 10-year Treasury
Note rose to 3.19%. Oil prices fell to $87 per barrel, and the national average price of gasoline according to AAA dropped to $3.79 per gallon.
© 2022. This material was prepared by Bob Cremerius, CPA/PFS, of Prudent Financial, and does not necessarily represent the views of other presenting parties, nor their affiliates. This information should not be construed as investment, tax or legal advice. Past performance is not indicative of future performance. An index is unmanaged and one cannot invest directly in an index. Actual results, performance or achievements may differ materially from those expressed or implied. All information is believed to be from reliable sources; however we make no representation as to its completeness or accuracy.
Securities offered through First Heartland Capital, Inc., Member FINRA & SIPC. | Advisory Services offered through First Heartland Consultants, Inc. Prudent Financial is not affiliated with First Heartland Capital, Inc.
