Executive Summary
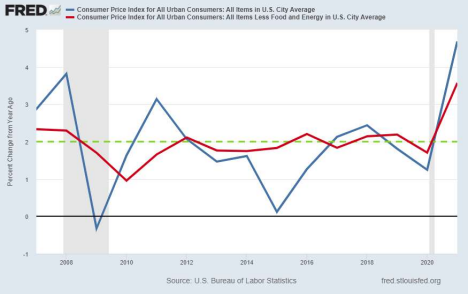
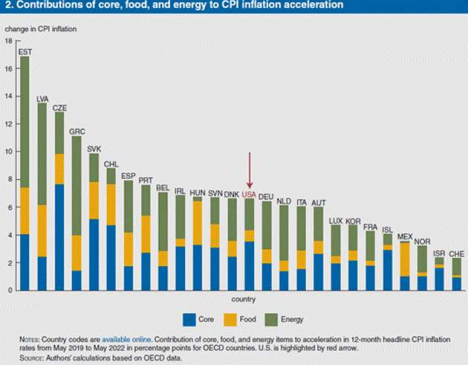
One Federal Reserve goal is maintaining an average of 2% inflation, which from around 2012 until the pandemic was a struggle (see first graph). Due to the massive government spending efforts and the supply constraints created from COVID19 and the Russia/Ukrainian war, inflation finally began to rise in 2020. Many labeled the rise as transitory and simultaneously blamed it primarily on gasoline prices. However, the USA’s energy (green in second graph) component represents about one-third of the total increase in inflation. The largest increase is in “core” or everything except food and energy. Inflation impacts all goods and services in the economy as well as the stock market. Many are hoping for a change in Federal Reserve policy to spur the stock market. However, Chairman Powell recently indicated they are committed to reducing inflation – even at the expense of the stock market and economy.
Please proceed to The Details.
“I don’t mind going back to daylight saving time. With inflation, the hour will be the only thing I’ve saved all year.”
–Victor Borge
The Details
By now, the impact of inflation is affecting the spending habits of most households. For years, prior to the pandemic, the Federal Reserve Bank (Fed) tried to force inflation up to 2%, which is their desired level. With average inflation falling below 2%, the Fed even announced they would tolerate inflation above 2% in order to push the average up to 2%. Then, the pandemic hit, and the Federal Government implemented an absurd amount of stimulus funded by the Fed. Inflation began to surge, but the Fed seemed unconcerned, labeling it “transitory.” After a while it had become clear the Fed had allowed inflation to get out of control. Eventually, fear of runaway inflation pushed the Fed to switch from monetary easing to record-setting tightening, both with interest rate hikes and QT (Quantitative Tightening or balance sheet reduction). See a graph of the Consumer Price Index (CPI) and Core CPI below.

The rise in inflation, beginning in 2020, was attributable to a combination of massive monetized Federal deficit spending and serious supply constraints due to Covid19 and the Russian / Ukrainian war. Many commentators tend to focus solely on the energy component of inflation because of its visibility and rapid increase. However, inflation has been widespread throughout the economy. The graph below from a recent Chicago Fed paper (via John Mauldin) shows the increase in inflation from the pre-pandemic period to now, by country. This increase is then broken down by core, food and energy components. The USA bar is highlighted with a red arrow. Notice the USA’s energy (green) component represents about one-third of the total increase in inflation. The largest increase is in “core” or everything except food and energy.

On Tuesday, September 13, the August CPI readings will be announced. Many will focus on the month-over-month (m-o-m) change as it is likely to be lower than year-over-year (y-o-y). However, the y-o-y number is more relevant to analyzing the outlook for inflation. With the recent drop in gasoline prices, many are expecting the m-o-m numbers to fall. Historically, more emphasis was placed on the “core” reading which eliminates the higher fluctuations attributable to food and energy. Many are hoping for the drop in gasoline prices to reduce the impact of the overall CPI change. Market participants are rooting for a drop in the inflation rate, hoping the Fed will then moderate their monetary policy. However, Chairman Powell made it clear in his speech at Jackson Hole that the Fed was determined to get inflation down even at the expense of a slowing economy or a drop in the market.
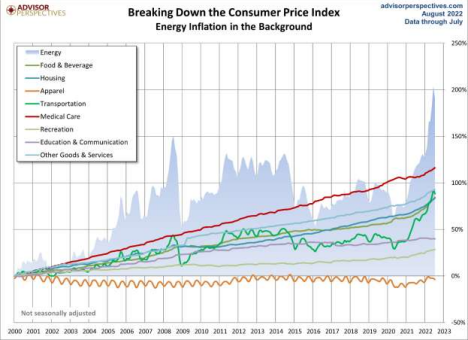
Regarding the increase in energy costs, “energy” is a subcomponent of other main categories included in the CPI, mainly transportation and housing. In the graph below from Advisor Perspectives, one can see the significant increase in transportation costs mostly attributable to fuel costs. The blue shading in the background illustrates the impact of energy inflation. It is important to realize, as explained by Advisor Perspectives, “The BLS does track Energy as a
separate aggregate index, which in recent years has been assigned a relative importance of 7.348 out of 100. In other words, Uncle Sam calculates inflation on the assumption that energy in one form or another constitutes 7.3% of total expenditures, 3.8% goes to transportation fuels — mostly gasoline (this is included in the “Transportation” category).” So, although energy costs are important in the analysis of inflation, they represent a relatively small component of total CPI inflation.

Inflation impacts the price of all goods and services. Additionally, it impacts the real return of the stock market. Although the S&P 500 might be down around 14% before inflation for the year, the “real” inflation adjusted loss for the year-to-date period would be closer to 19-22% (depending upon which inflation adjustment is used). Economist Gary Shilling pointed out in his recent newsletter that the impact of high inflation in the late 1970’s on both corporate profits and the stock market were significant. He calculated that from the fourth quarter 1968 to the third quarter of 1982 (14 years), the S&P 500 adjusted for inflation, plunged by 63%!

The impact of inflation is widespread and could be long-lasting. The Fed’s determination to rein in inflation means they will likely not change monetary policy until they feel assured, they can reach their inflation goal. As a result, corporate earnings and economic growth will feel the effects of rising short-term interest rates and a significant drop in liquidity. To understand the real picture, it is imperative to incorporate the impact of inflation.
The S&P 500 Index closed at 4,067, up 3.6% for the week. The yield on the 10-year Treasury Note rose to 3.32%. Oil prices remained at $87 per barrel, and the national average price of gasoline according to AAA dropped to $3.72 per gallon.
© 2022. This material was prepared by Bob Cremerius, CPA/PFS, of Prudent Financial, and does not necessarily represent the views of other presenting parties, nor their affiliates. This information should not be construed as investment, tax or legal advice. Past performance is not indicative of future performance. An index is unmanaged and one cannot invest directly in an index. Actual results, performance or achievements may differ materially from those expressed or implied. All information is believed to be from reliable sources; however we make no representation as to its completeness or accuracy.
Securities offered through First Heartland Capital, Inc., Member FINRA & SIPC. | Advisory Services offered through First Heartland Consultants, Inc. Prudent Financial is not affiliated with First Heartland Capital, Inc.

