Executive Summary
Everyone is paying more for groceries and gasoline, so inflation is the concern of the day. The Federal Government stimulus payments provided short-term boosts to demand for goods and services during the pandemic. However, now prices are being propped up by supply constraints rather than excess demand. Typically, the bond market is a better predictor of the economy than the stock market. Though the recent Consumer Price Index is revealing current inflation of 6.2%, what is the bond market indicating? Using Treasury Inflation Protected Securities (TIPS), inflation can be estimated for future periods.
See what the bond market is estimating for future inflation in The Details below.
“Inflation is the crabgrass in your savings.”
–Robert Orben
The Details
It is true! Everyone is paying more for groceries, housing and gasoline. Inflation, as captured by the Consumer Price Index (CPI), has jumped led by housing and commodities. The questions on everyone’s’ mind include: How much higher are prices going? And how long will they remain high? The word of the day is “transitory.” Is inflation transitory or temporary? How long is “transitory”? Six months? One year? Longer? In this missive I will examine how the bond market is interpreting inflation.
Regular readers know I believe the bond market is a better predictor of the economy than the stock market. Stock prices tend to disconnect from fundamentals for lengthy periods, while bond yields, although subject to short-term fluctuations, better reflect the underlying economy. That being said, what has pushed prices up so high? The answer consists of several factors, starting with the unprecedented government response to the pandemic. Massive stimulus and benefit programs pumped an extraordinary amount of funds into consumers’ hands. With these extra funds, savings and spending soared higher. The spending provided a short-term “sugar-high” for the economy. The stimulus is now gone, and savings are being depleted; so, will consumer demand be strong enough going forward to promote higher inflation? See the graphs below of disposable personal income and personal savings / savings rate. Notice the recent drop-off in income and savings.


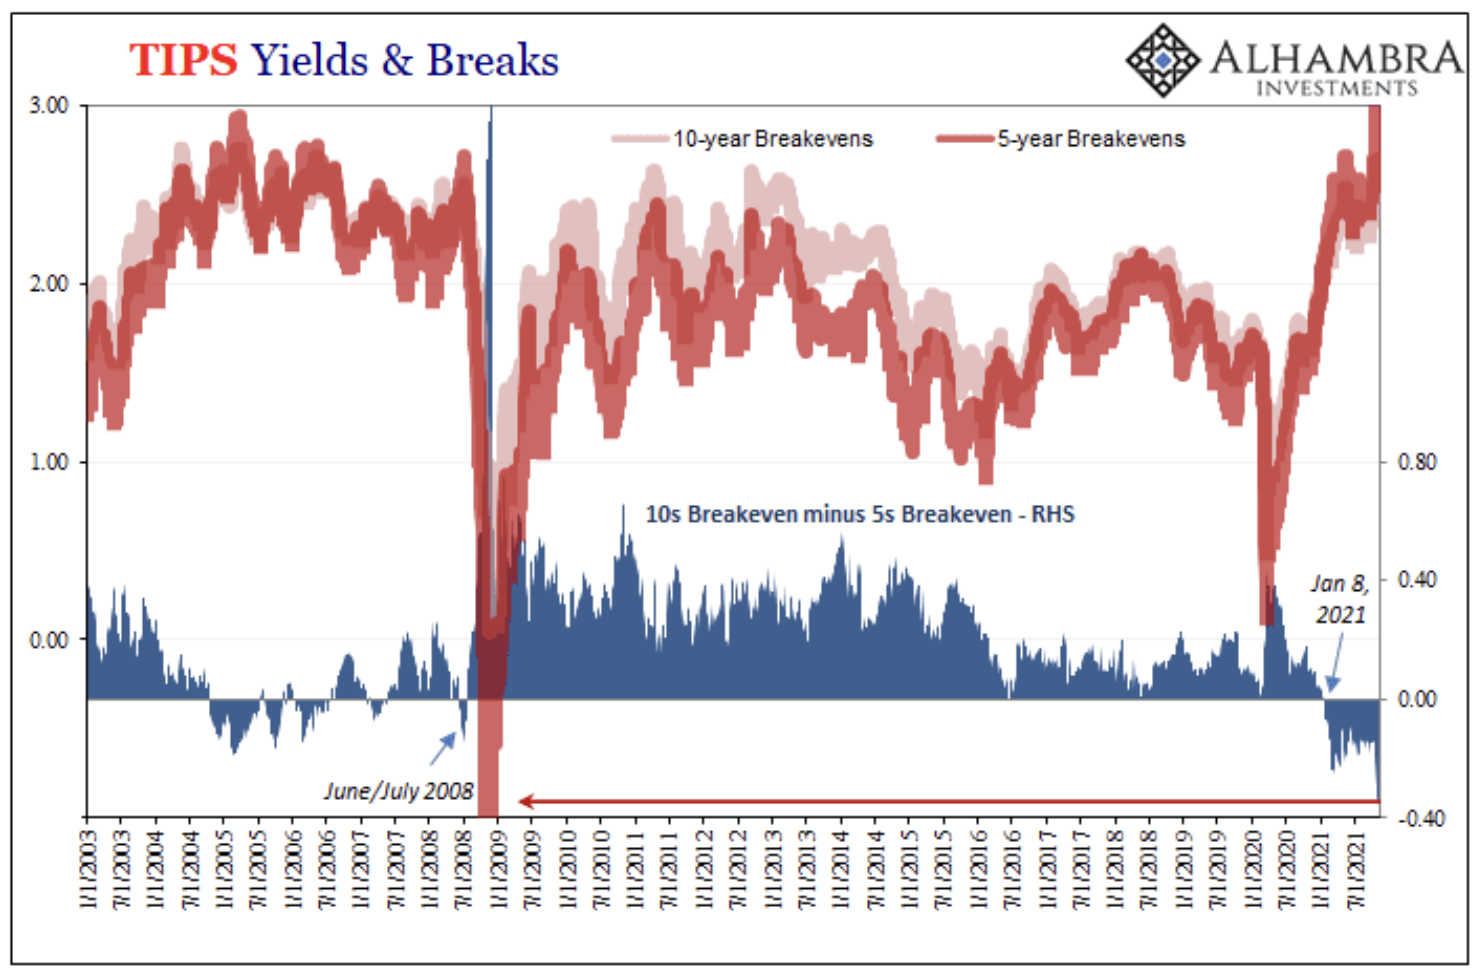
Prices now are being propped up by supply constraints, not excess demand. Is the bond market projecting continued supply/port problems and decreased oil/energy production? When it comes to the inflation outlook, normally the five-year outlook is lower than the 10-year expectation. However, currently the outlooks are inverted when looking at the five and 10-year breakevens. (Breakevens represent the expected inflation rate for that period and are calculated by subtracting the yield on Treasury Inflation Protected Securities (TIPS) from the constant maturity 10-year Treasury Note yield.) Notice in the graph below from Jeffrey Snider of Alhambra Investments, the expected five-year inflation rate is higher than the 10-year rate for the first time since 2008.

According to the CPI, prices inflated 6.2% over the last 12 months. If sustainable this would create enormous havoc in our economy and in the financial system. According to a University of Michigan survey, one-year inflation expectations (blue line in graph below) have risen to 4.6%, lower than the current CPI reading. However, the five-year breakeven inflation rate (red line in graph below) is 3.1%. And the five-year forward inflation rate (inflation expectations for years 6-10 – green line below) is only 2.4%. The bond market seems to be expecting inflation to be relatively short-term or “transitory” depending upon one’s definition of transitory.

Again, the CPI is showing current inflation at 6.2% (blue line in graph below). However, the 10-year Treasury Note yield (red line in graph below) is only around 1.6%, and the yield on the 10-year Treasury Note adjusted for inflation (green line in the graph below) is -1.85%.

Despite the high CPI (6.2%), the further out one looks, the lower the bond market expectation for high inflation. The University of Michigan’s one-year outlook is for 4.6% inflation, five-year breakevens call for 3.1%, the five-year forward inflation rate is only 2.4%. The nominal 10-year Treasury Note is yielding a low 1.6%. Overall, the bond market seems to be calling for inflation to be temporary. Notice in the graphs above the CPI and University of Michigan inflation expectation back in 2008. Now look at what occurred subsequently.
Yes, inflation is real. However, it is currently being caused by supply constraints, not a booming economy creating excess demand. The truly transitory surge in consumers’ income and savings, due to government transfer payments, has ended. Consumers will be forced to increase debt to fulfill their future consumption needs. Higher debt will reduce future demand. A temporary period of inflation with weakening demand and rising debt should be expected, followed by a possible deflationary period as the bubbles burst and asset prices plummet. For now, the bond market believes inflation is temporary.
The S&P 500 Index closed at 4,683 down 0.3% for the week. The yield on the 10-year Treasury Note rose to 1.58%. Oil prices remained at $81 per barrel, and the national average price of gasoline according to AAA fell to $3.41 per gallon.
Thank you for taking the time to read this week’s report. If you frequent these posts, you know that I always like to take a moment of my day to be grateful for the life I live and to think of new ways to help those around me.
With that being said, I’d like to invite you to join me in supporting St. Jude’s Children’s Research Hospital.
I am a St. Jude Hero! I have chosen to run for a reason bigger than myself by fundraising for the kids and families at St. Jude. I am training to cross the finish line on race day and with your donation we can cross the fundraising finish line together because the money you donate helps find a cure for childhood cancer.
© 2021. This material was prepared by Bob Cremerius, CPA/PFS, of Prudent Financial, and does not necessarily represent the views of other presenting parties, nor their affiliates. This information should not be construed as investment, tax or legal advice. Past performance is not indicative of future performance. An index is unmanaged and one cannot invest directly in an index. Actual results, performance or achievements may differ materially from those expressed or implied. All information is believed to be from reliable sources; however we make no representation as to its completeness or accuracy.
Securities offered through First Heartland Capital, Inc., Member FINRA & SIPC. | Advisory Services offered through First Heartland Consultants, Inc. Prudent Financial is not affiliated with First Heartland Capital, Inc.

