Executive Summary
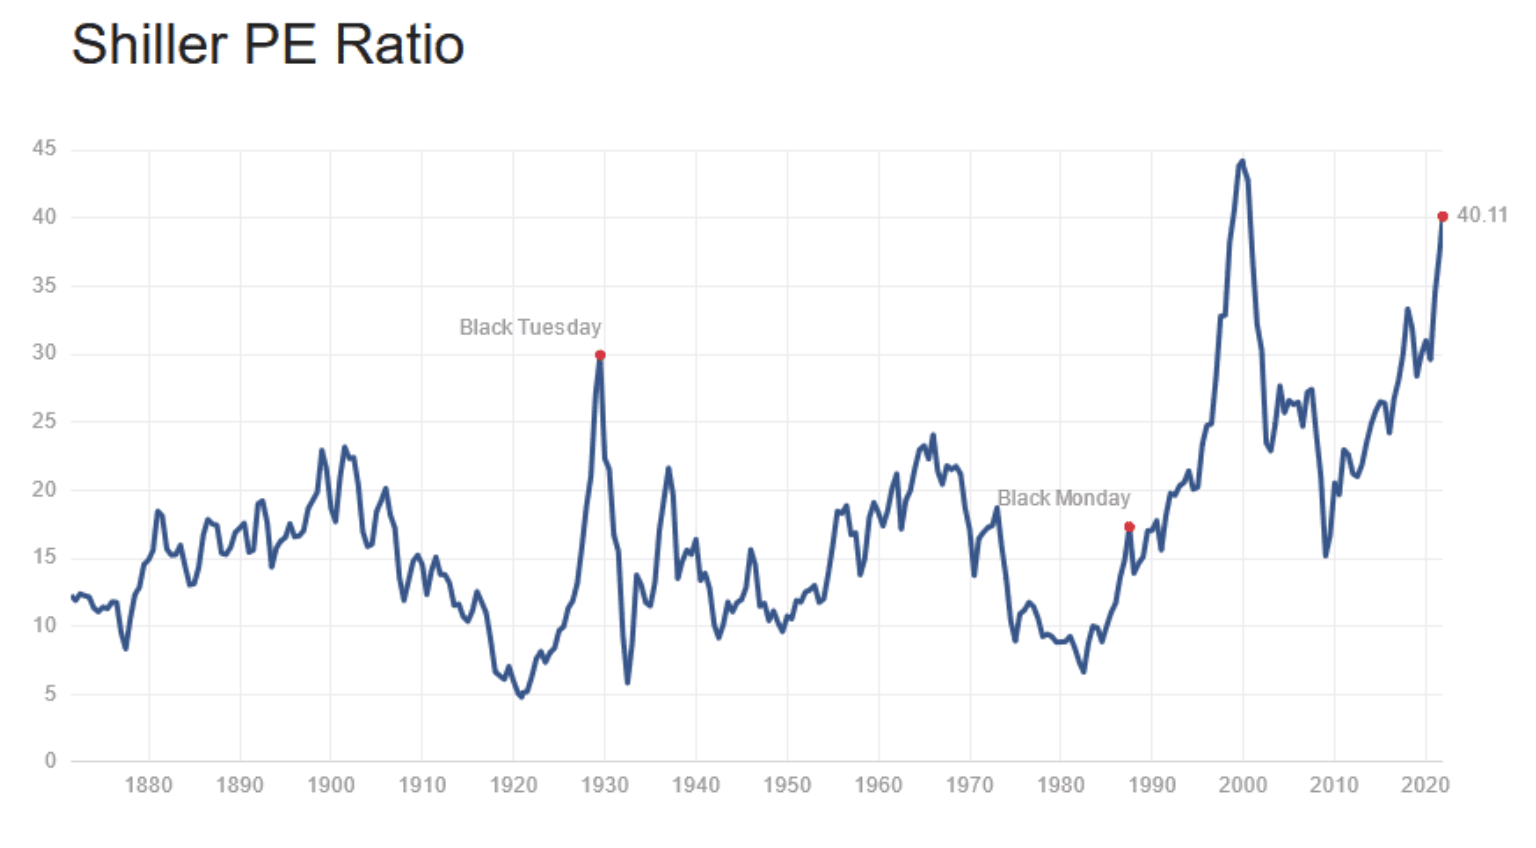
In January 1999 the Shiller P/E broke 40 and by December of 1999 peaked at 44. Having been in the business at that time, I recall many in the industry looking back in hindsight commenting those overvaluation levels would never be reached again. But what do you know, 21 years later and the Shiller P/E broke 40 again (see second graph). Government stimulus programs and the Fed policies have produced short term surges in growth and corporate profits. However, currently, the “sugar high” is wearing-off. Please read the entire commentary for my full take on how reductions in consumer sentiment, weakening corporate profit margins and inflation all contribute to the risks in the current extremely overvalued market.
Please proceed to The Details for a complete look.
“It amazes me how people are often more willing to act based on little or no data than to use data that is a challenge to assemble.”
–Robert Shiller
The Details
The arrival of the pandemic and associated lock-downs led to a severe plummet in what was already anemic economic growth. And by extension, brought about a plunge in corporate profits. The response by the Federal government was the implementation of unprecedented stimulus, sending the Federal deficit soaring. By design, this stimulus resulted in a strong, but temporary, surge in economic growth and rebound in corporate profits. As stated by economist Lance Roberts of Real Investment Advice,
“The ‘sugar high’ of economic growth seen in the first two quarters of 2021 resulted from a massive deficit spending surge. While those activities create the ‘illusion’ of growth by pulling forward ‘future’ consumption, it isn’t sustainable, and profit margins will follow suit quickly.
The point here is simple, before falling victim to the ‘buy the market because it’s cheap based on forward-estimates’ line, make sure you understand the ‘what’ you are paying for.
Wall Street analysts are always exuberant, hoping for a continued surge in earnings in the months ahead. But such has always been the case.”
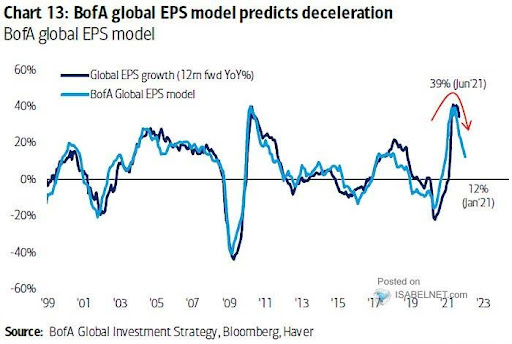
The chart below illustrates the earnings impact of the stimulus programs is starting to wane. The Bank of America Global EPS (earnings-per-share) model has already fallen from its peak.

The trillions pumped into the economy through various stimulus programs sent the stock market soaring. This combined with massive QE (Quantitative Easing) by the Fed and near-zero interest rates has pushed stock market valuations into the stratosphere. The Shiller P/E Ratio named after economist and Yale professor Robert Shiller recently breached 40 for the first time in over 21 years. The Shiller P/E is calculated by dividing the price of the S&P 500 by 10-year inflation-adjusted average earnings per share. In January 1999, the Shiller P/E broke 40. It peaked in December 1999 at 44, shortly before the beginning of the Tech Bubble crash. By the end of September 2000 with the market falling, the Shiller P/E fell below 40 not to see that level of overvaluation again until last Friday. I was in the business during this time and remember advisors looking back in hindsight stating the market would never again achieve such an incredible level of overvaluation. Surprise! It is here, look at the graph of the Shiller P/E below.

The risks to stocks are stacking up and include: stimulus funds are in the rearview mirror, the Fed is beginning to taper its bond purchases, by some measures the market is more overvalued than ever before, the economy is weakening, consumer sentiment is falling, and inflation remains high. High inflation adds to poor consumer confidence and weakens corporate profit margins as companies try to balance input prices versus sales prices. Lance Roberts wrote the following:
“However, while the Fed remains focused on keeping markets elevated, inflation poses a significant risk.
Currently, with PPI at the highest spread to CPI in history, it suggests producers can’t pass on costs to customers. Such equates to weaker profit margins and earnings in the future. However, if they elect to pass those costs onto consumers, such will raise living costs well above wages.”
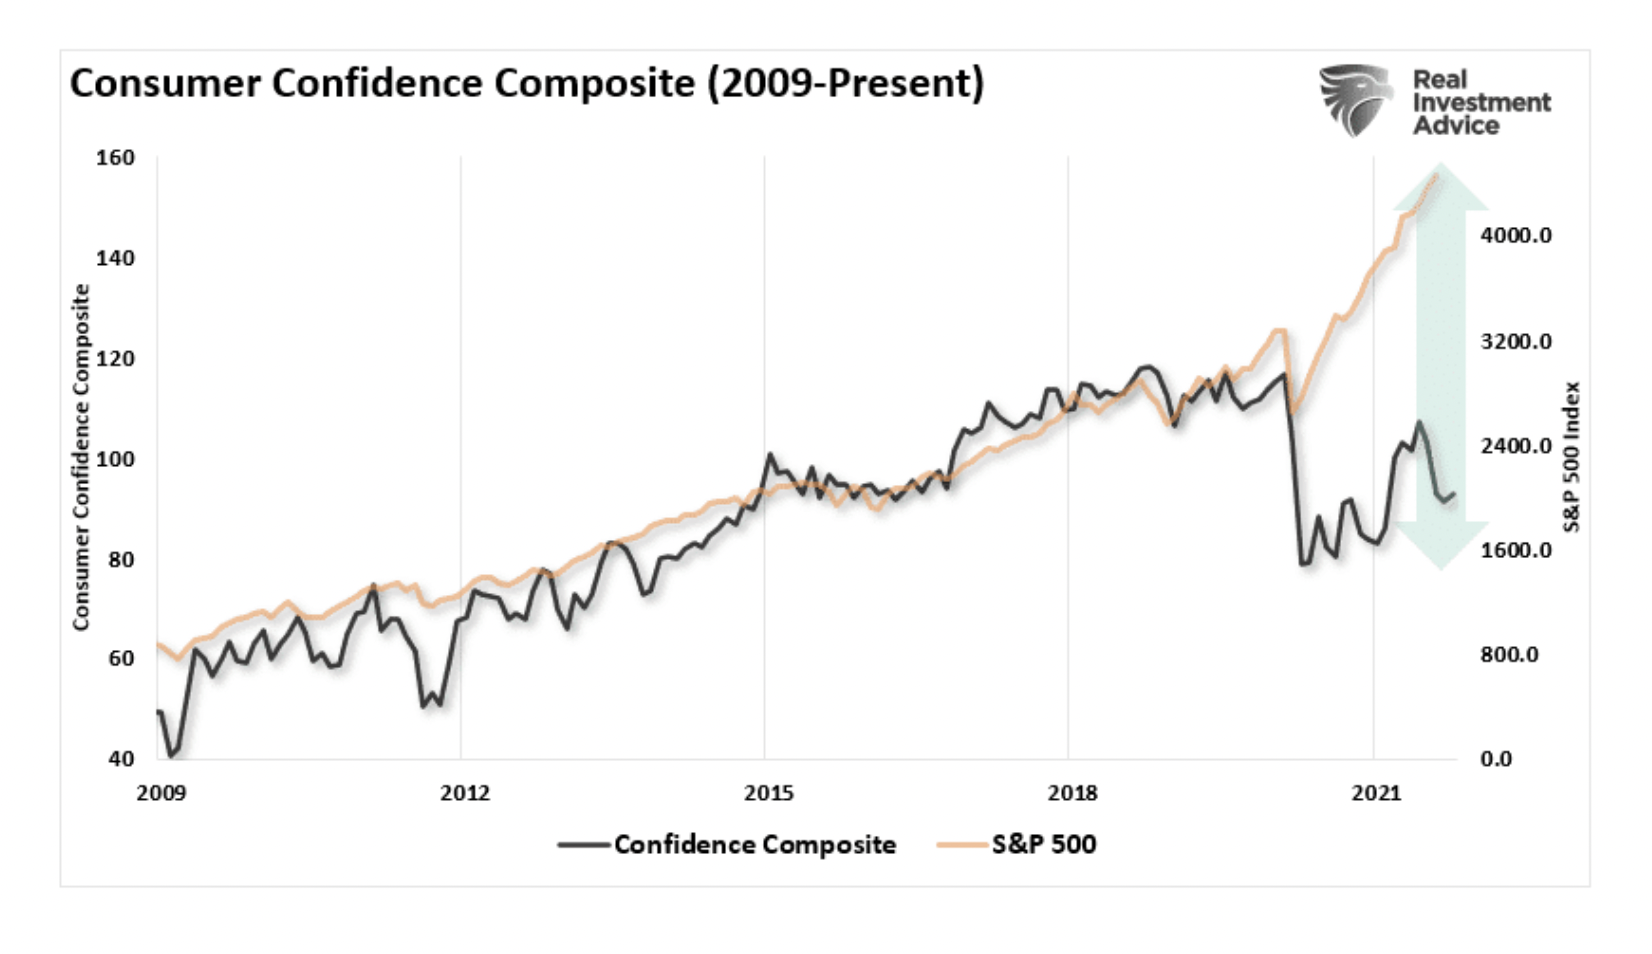
Notice in the graph below, the wide gap which has developed between consumer confidence and the S&P 500. To close the gap would require a major selloff in the stock market.

While it is possible for the market to continue to soar pushing the Shiller P/E to an all-time high over 44, such a move would be temporary and is already on borrowed time. Notice in the Shiller P/E graph shown above what occurred after prior peaks in this valuation measure. I would not expect this time to be any different.
The S&P 500 Index closed at 4,698 up 2% for the week. The yield on the 10-year Treasury Note fell to 1.45%. Oil prices fell to $81 per barrel, and the national average price of gasoline according to AAA rose to $3.42 per gallon.
Thank you for taking the time to read this week’s report. If you frequent these posts, you know that I always like to take a moment of my day to be grateful for the life I live and to think of new ways to help those around me.
With that being said, I’d like to invite you to join me in supporting St. Jude’s Children’s Research Hospital.
I am a St. Jude Hero! I have chosen to run for a reason bigger than myself by fundraising for the kids and families at St. Jude. I am training to cross the finish line on race day and with your donation we can cross the fundraising finish line together because the money you donate helps find a cure for childhood cancer.
© 2021. This material was prepared by Bob Cremerius, CPA/PFS, of Prudent Financial, and does not necessarily represent the views of other presenting parties, nor their affiliates. This information should not be construed as investment, tax or legal advice. Past performance is not indicative of future performance. An index is unmanaged and one cannot invest directly in an index. Actual results, performance or achievements may differ materially from those expressed or implied. All information is believed to be from reliable sources; however we make no representation as to its completeness or accuracy.
Securities offered through First Heartland Capital, Inc., Member FINRA & SIPC. | Advisory Services offered through First Heartland Consultants, Inc. Prudent Financial is not affiliated with First Heartland Capital, Inc.

