Executive Summary
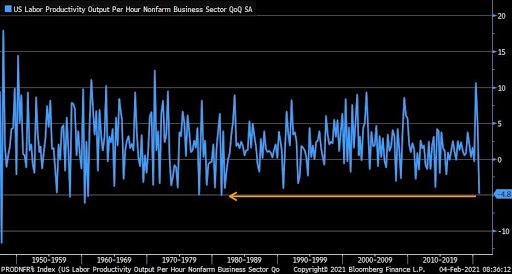
Many Americans hope the COVID 19 vaccine will help return life to normal. And as the title asks, what will be the economic normal? The decade prior to 2006 produced average real economic growth of three percent or more; however, the past decade has averaged a mere 2.07% (first chart). Attaining that growth rate was also accompanied by soaring total debt. A whopping $5.2 trillion in additional total-sector debt was added in 2020 alone. See the surge in total debt growth versus growth in GDP in the third graph below. Economic growth is achieved either through growth in the labor force or productivity growth. The fourth and fifth graphs show the drop in the labor force participation rate and productivity’s recent decline. The U.S. has reached the point where continuous government stimulus is required ($1.9 trillion currently on the table) to prevent falling deeper into recession. “Normal” may be a fluid concept.
Please proceed to The Details.
“Everybody wants to eat at the government’s table, but nobody wants to do the dishes.”
–Werner Finck
The Details
The hope of speculators in the derailed stock market is the vaccination of the majority of the population will lead to “herd immunity” which will allow the economy to return to normal. The focus of this Update is determining what is “normal.” The belief that the vaccine is some type of elixir which can magically “undo” the damage done to an already slowing economy which accelerated into a recession due to the pandemic is to ignore reality.
It first must be determined to which “normal” the economy will return. To listen to the “experts” one would believe the economy will quickly return to a real (inflation adjusted) growth rate of 3% or higher. That would mean a return to the pre-2006 decade as shown in the chart below.

Over the prior decade (post-Great Recession) the average annual real growth rate has been a mere 2.07%. This is illustrated in the graph below from Advisor Perspectives. Note, the recent quarterly surge was merely a bounce back from the extreme quarterly drop as the current recession ensues.

Those calling for growth above 3% going forward assume the economy is positioned to grow at a rate higher than the average over the prior 10-years. This, despite adding over $5.2 trillion in total debt since December 31, 2019. These additions produced the highest debt growth rate in over three decades, double the rate of growth prior to the current recession. See the surge in total debt growth versus growth in GDP in the graph below.

Economic studies have proven that debt at these levels results in significantly reduced GDP growth. In order to see economic growth, there must be an increase in either the labor force or productivity. The following graph provides a picture of the long-term change in the labor force participation rate. Notice the participation rate’s long-term decline, and the fact the rate remains far below even the pre-pandemic level.

Productivity (output per hour) dropped 4.8% in the fourth quarter 2020. This was the largest quarterly drop since 1981.

Declining productivity and a low labor force participation rate portends for weaker economic growth. When combined with skyrocketing debt, this situation presents tremendous obstacles before any possibility of returning to pre-2006 growth rates. Currently, total all-sector debt of $52.6 trillion represents 245% of GDP. The new stimulus proposal of $1.9 trillion assures the rate of change of debt will continue its ascent.
Recently it was reported that the trade balance has decreased to Great Recession levels. A trade deficit is a subtraction from GDP growth. This is yet one more contributor to weakening near-term economic growth.

Unfortunately, the U.S. has reached the point where continuous stimulus is required to keep the economy from slipping deeper into recession. The stimulus adds to the Government debt outstanding which increases the drag on overall economic growth. The only way to return to a place where pre-2006 growth rates are possible, is to first deal with the mountain of perpetually growing debt. This will entail defaults and restructuring likely resulting in a financial crisis; but it is necessary in order to eventually return to “normal.”
The S&P 500 Index closed at 3,887, up 4.6% for the week. The yield on the 10-year Treasury Note rose to 1.17%. Oil prices increased to $57 per barrel, and the national average price of gasoline according to AAA rose to $2.46 per gallon.
© 2020. This material was prepared by Bob Cremerius, CPA/PFS, of Prudent Financial, and does not necessarily represent the views of other presenting parties, nor their affiliates. This information should not be construed as investment, tax or legal advice. Past performance is not indicative of future performance. An index is unmanaged and one cannot invest directly in an index. Actual results, performance or achievements may differ materially from those expressed or implied. All information is believed to be from reliable sources; however we make no representation as to its completeness or accuracy.
Securities offered through First Heartland Capital, Inc., Member FINRA & SIPC. | Advisory Services offered through First Heartland Consultants, Inc. Prudent Financial is not affiliated with First Heartland Capital, Inc.

