Executive Summary
Rather than focusing on the published unemployment rate, looking at the actual employment data can be more telling. Last week’s Bureau of Labor Statistics employment reported a loss of 140,000 jobs in December. Since December of 2019, the number of employed individuals has fallen by 8.9 million people, and over 19 million remain on some form of unemployment assistance (see second chart below). The first graph shows the Labor Force Participation rate since the 2008 Financial Crisis, combined with some anecdotal evidence on some Memphis Food Bank lines, and the picture does not look so great. And now for the challenge, I have included some financial information on Amazon, Tesla and the Russel 2000 Index supporting the mania phase. Can our readers prove that manias are durable?
Please proceed to The Details.
“A thousand things can prove me right and one can prove me wrong.”
–Albert Einstein
In trying to determine whether the economy is reflating or not, one of the best indicators to look at is the actual employment numbers, not the quoted unemployment rate. Last Friday the Bureau of Labor Statistics (BLS) issued their monthly Employment Situation Summary. To everyone’s surprise, total payrolls fell by a whopping 140,000 jobs in December, according to the Establishment Survey. The number of employed individuals according to the Household Survey has fallen by 8.9 million since December 2019.
Sometimes I am accused of reporting pessimistic information. Let me explain, I am merely trying to show the truth via factual data. Too often the mainstream media, and large investment firms try to paint a rosy face on every situation. By doing so, they often mislead the general public who get their news in one-minute snippets on social media. Receiving misleading information, or incomplete information, can lead investors to make poor decisions. I merely attempt to show the full picture put in historical perspective. That being said, the following is a graph of the Labor Force Participation Rate or the percentage of working-age individuals actually employed or looking for work. Looking closely, you can see how the recent bounce off of the bottom has now turned back downward. Notice also how much lower the rate is today versus at the bottom of the Great Recession in 2009.

Most state unemployment benefits run for about 26 weeks. Under the CARES Act, the Federal Government extends state benefits for up to an additional 13 weeks with the Pandemic Emergency Unemployment Compensation program. Since the pandemic started over 10-months ago, many have already exhausted their unemployment compensation. The following chart was excerpted from a DOL (Department of Labor) report issued January 7, 2021, illustrating the sad state of unemployment. Over 19 million individuals remain on some form of unemployment assistance not counting those who have dropped-off the rolls.

Now a little anecdotal information. Within one mile of my house (in East Memphis), in two different directions, there are churches which act as Food Banks delivering food to those in need. Every two weeks the lines of cars at these churches stretch almost as far as the eye can see. This continues to this day and shows the real state of the economy.
While the media headlines might find a datapoint to justify their claim the economy is “bouncing back,” the numbers (and anecdotal evidence) suggest the situation is more dire.
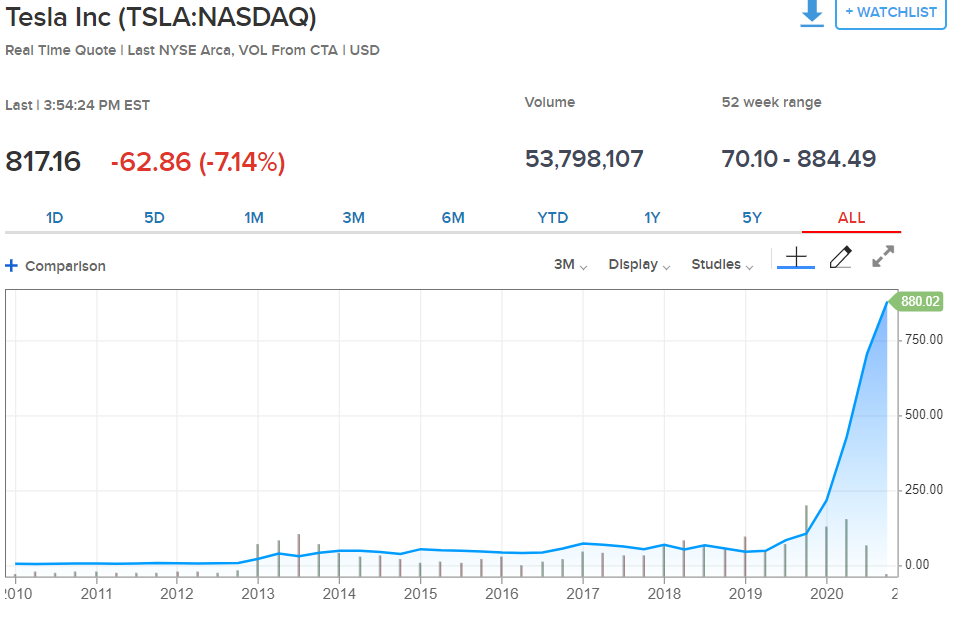
While this situation continues, the stock market remains in a mania state as described in last week’s missive. I would like to issue a challenge to my readers. Even in drastically overvalued markets, there are always those who attempt to justify stock prices. A quick glance on financial Twitter will prove that claim. I am going to show several price charts below, similar to last week, highlighting the vertical ascent in certain stocks or indexes. I challenge readers to show me one example historically, where this type of market activity continued indefinitely and did not eventually end in tears.
First up, Amazon. Amazon is now trading at a price-to-earnings ratio (P/E) over 91.

Next, a repeat from last week, Tesla. Tesla is trading at a P/E (get ready for it!) of over 1,600. You read that right; I did not leave out a decimal point. And no, you probably have never seen a P/E ratio that high before.
And finally, the Russell 2000 Index, or an index of 2,000 smaller public companies. These happen to be the companies most vulnerable presently for filing bankruptcy. A large percentage of these companies are “zombies” meaning their profits (if they have any) do not cover their interest costs. In the graph below, notice the vertical ascent which began at the bottom of the March 2020 downturn. This move was not spurred by increasing earnings or anything fundamental for that matter.


So, there you have it. A brief summary of the employment picture combined with a challenge to prove to me stock prices in a mania will remain that way. I hope you can show me some interesting charts.
The S&P 500 Index closed at 3,825, up 1.8% for the week. The yield on the 10-year Treasury Note rose to 1.11%. Oil prices increased to $52 per barrel, and the national average price of gasoline according to AAA rose to $2.31 per gallon.
© 2020. This material was prepared by Bob Cremerius, CPA/PFS, of Prudent Financial, and does not necessarily represent the views of other presenting parties, nor their affiliates. This information should not be construed as investment, tax or legal advice. Past performance is not indicative of future performance. An index is unmanaged and one cannot invest directly in an index. Actual results, performance or achievements may differ materially from those expressed or implied. All information is believed to be from reliable sources; however we make no representation as to its completeness or accuracy.
Securities offered through First Heartland Capital, Inc., Member FINRA & SIPC. | Advisory Services offered through First Heartland Consultants, Inc. Prudent Financial is not affiliated with First Heartland Capital, Inc.

