Executive Summary
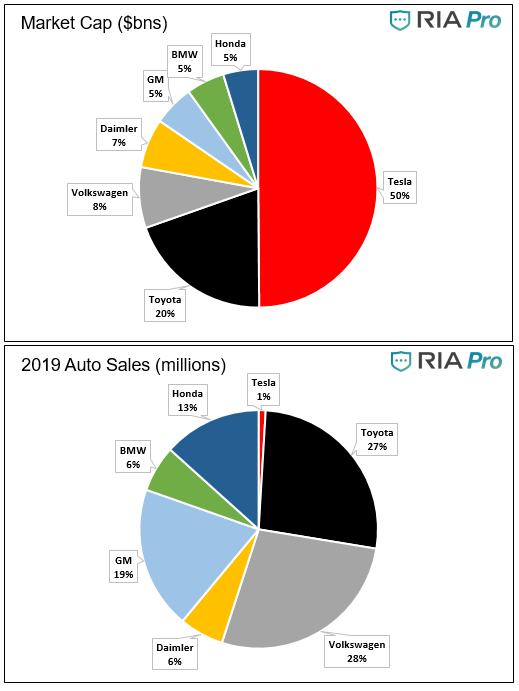
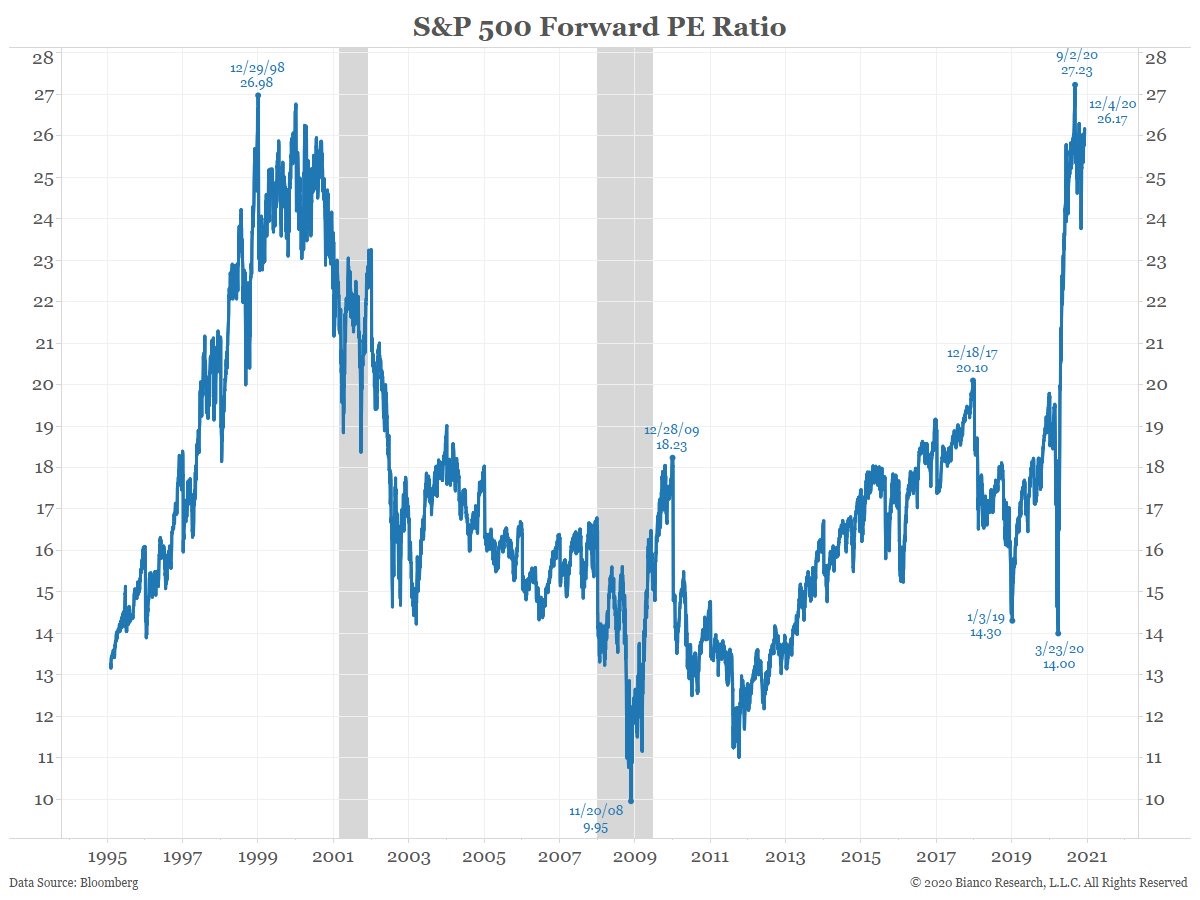
In this week’s missive, I give both a visual and an audible example of how over-valued the current stock market bubble is. First the visual of Tesla’s market capitalization and sales versus the other 50% of the auto industry. Next the audible of how speculators begin stating this time is different. Phrases such as: It is a “New Era” (from the 1920’s) or a “New Economy” (1990’s) or the Fed will prevent the market from ever dropping (today). Take a look at the remaining graphs in The Details and recall the 2000 peak plunged 50% for the S&P 500 and 83% for the NASDAQ 100. Mark Twain stated, “History doesn’t repeat itself, but it often rhymes.” I believe the graphs show a tilting boat!
Please proceed to The Details.
“The stock market is never obvious. It is designed to fool most of the people, most of the time.”
–Jesse Livermore
The Details
If everyone on a crowded boat walks to one side, there is a high probability that the boat is going to tip over. The stock market reacts much the same way. By now it is obvious to anyone who has studied history, economics, and finance; the stock market is more overvalued than ever before in history. There are certain obscure examples which paint a clear picture of the insanity present in today’s stock market. Some visible, others audible. One of the best visualizations for current market conditions is to examine the market capitalization versus sales of one of the – if not the – most egregiously priced stocks on the exchange. If you examine the graph below, from economist Lance Roberts of Real Investment Advice, no additional explanation should be needed. Notice the company with only 1% of auto sales versus 50% of total auto manufacturers’ market cap!
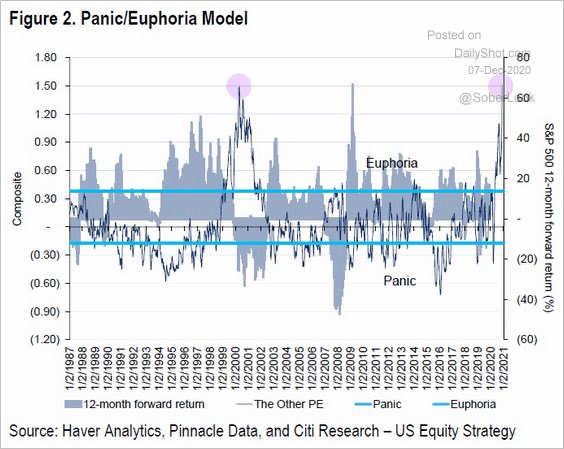
The result shown above occurs when investors have morphed into speculators and throw all concern for fundamentals out of the window. Sentiment reaches euphoria near the top of all stock market bubbles. Notice in the graph below, the euphoria has only been equaled at the top of the Technology Bubble in early 2000, just before a punishing bear market ensued destroying 50% of value in the S&P 500 and seeing the NASDAQ 100 lose 83%.
And now for the audible. Speculators begin stating this time is different. It is a “New Era” (from the 1920’s) or a “New Economy” (1990’s) or the Fed will prevent the market from ever dropping (today). In the late 1990’s a renowned investment manager – to his chagrin – accepted the challenge he could pick stocks better than a blindfolded monkey. Well, as they say, the rest is history. Today, I hear college-aged kids are day-trading stocks because it “is so easy to make money.” Oh, the lesson they will learn!
Lance Roberts stated the following in his recent blog:
“The current deviation between the market and underlying economic growth is the largest in history. Given the high correlation between the economy, corporate profits, and stock prices over the long-term, the ‘Market Capitalization’ to ‘Gross Domestic Product’ ratio tells us much.”
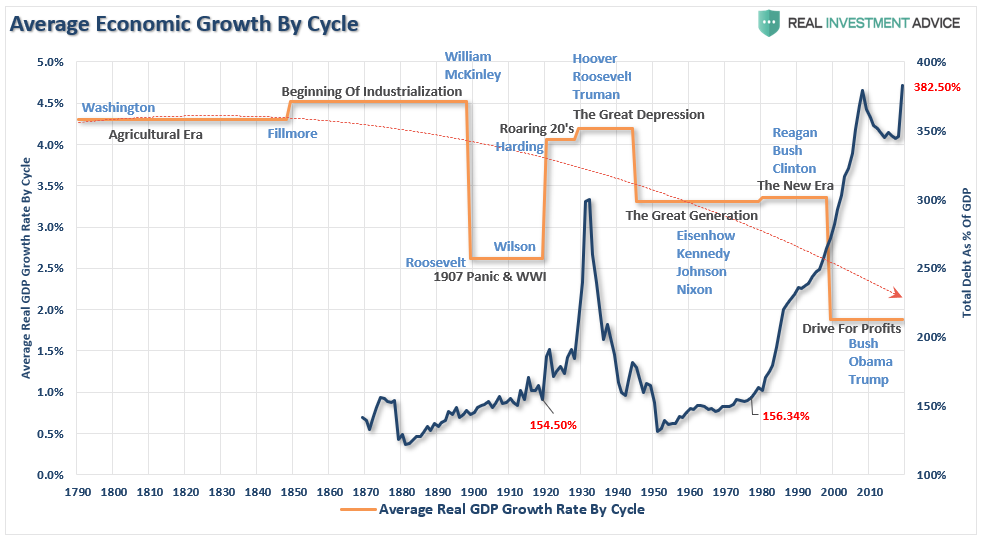
The outrageousness of soaring stock prices and plummeting corporate earnings can only be explained by concocted phrases which have never proven true in the long run.
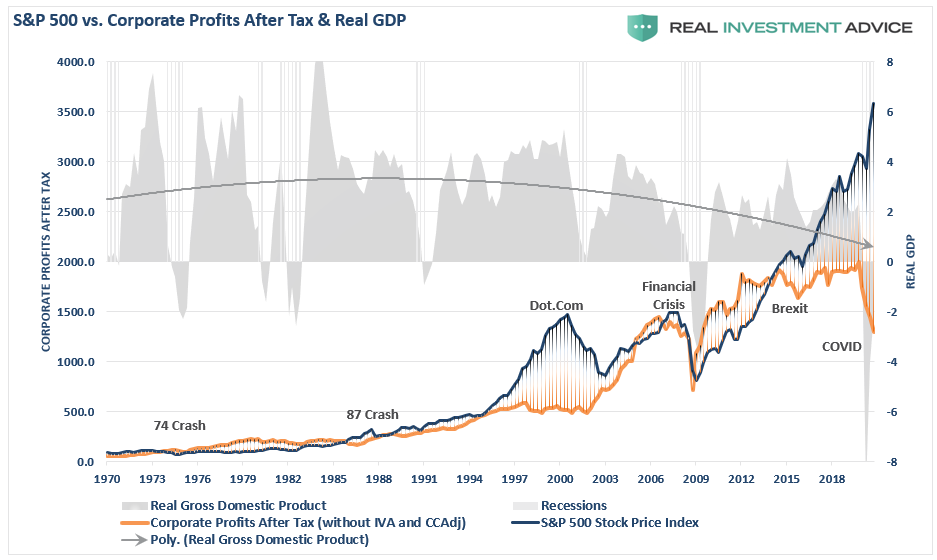
The following illustrates the crowd gathering on one side of the boat.
Lance wrapped up his blog writing:
“Today, while stock prices can be lofted higher by further monetary tinkering, the underlying fundamentals are inverted. The larger problem remains the economic variables’ inability to ‘replay the tape’ of the ’20s, the ’50s, or the ’80s. At some point, the markets and the economy will have to process a ‘reset’ to rebalance the financial equation.”
The reversion to the mean will occur reconnecting stock prices to those justified by earnings. Every prior bubble has ended in tears for speculators who insisted the market would never go down. The longer it takes for the reversion to start, the further the market climbs resulting in even greater eventual heartbreak. Remember, the 2000 peak plunged 50% for the S&P 500 and 83% for the NASDAQ 100. Mark Twain stated, “History doesn’t repeat itself, but it often rhymes.”
Every sensible piece of data I have viewed recently indicates the passengers are hugging one side of the boat. The extremes have never been greater. When the boat tips over, the lessons from past cycles will be learned by a new pack of speculators and relearned by some with tinges of gray!
The S&P 500 Index closed at 3,699, up 1.7% for the week. The yield on the 10-year Treasury Note rose to 0.97%. Oil prices remained at $46 per barrel, and the national average price of gasoline according to AAA rose to $2.16 per gallon.
© 2020. This material was prepared by Bob Cremerius, CPA/PFS, of Prudent Financial, and does not necessarily represent the views of other presenting parties, nor their affiliates. This information should not be construed as investment, tax or legal advice. Past performance is not indicative of future performance. An index is unmanaged and one cannot invest directly in an index. Actual results, performance or achievements may differ materially from those expressed or implied. All information is believed to be from reliable sources; however we make no representation as to its completeness or accuracy.
Securities offered through First Heartland Capital, Inc., Member FINRA & SIPC. | Advisory Services offered through First Heartland Consultants, Inc. Prudent Financial is not affiliated with First Heartland Capital, Inc.

