Executive Summary
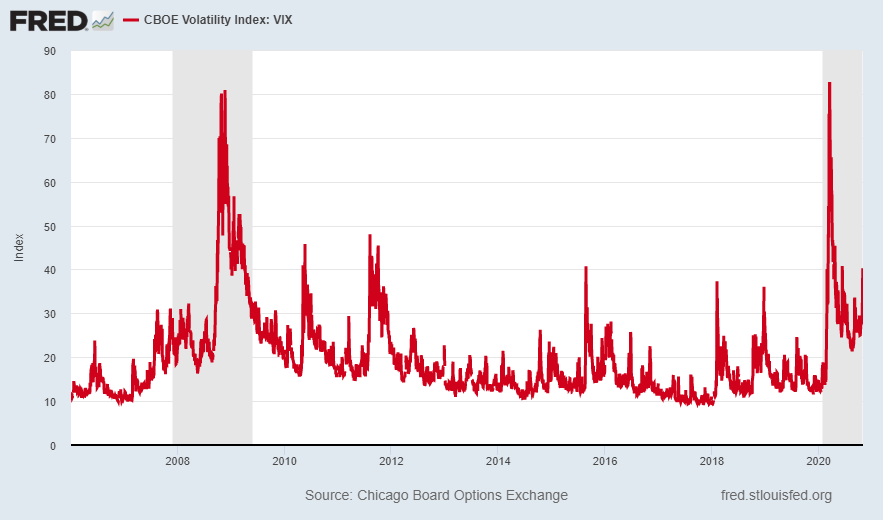
In this week’s missive I look at other measures in addition to price when evaluating markets. The VIX Index is a measure of the short-term volatility or risk in the market. In “normal times” the VIX is around 13; last week it closed at 38. In addition, last week’s volume increased on market down days and decreased on market up days. All of this indicates extreme risk in the market. Interestingly, this does not even take into account the price and valuation measurements which are extremely disconnected from corporate earnings. Much of the situation seems dependent upon government stimulus, the election, and the pandemic. Things will be interesting this week….so buckle up!
Please proceed to The Details.
“Games are won by players who focus on the playing field – not by those whose eyes are glued to the scoreboard.”
–Warren Buffett
The Details
One way shorter-term risk is measured in the equity markets is with the VIX Index. A simplified explanation of the VIX is that it represents expected volatility or risk over the coming 30 days. Many investors look strictly at price when evaluating the stock market. The price is compared to some moving average or valuation measurement. Valuation calculations determine how the current price compares to long-term norms. The valuation is typically determined based upon some measure of earnings, revenues or even GDP. Valuations tend to be good determinants of where stock prices will end up in the long run, whereas, the VIX has a shorter-term outlook. Research firm, Hedgeye Risk Management, LLC always states one must examine price, volume and volatility to get a more complete picture of markets. The VIX is a measure of volatility. One can even track the volatility of volatility or the volatility of the VIX.
The higher the VIX the greater the risk is in markets, and the greater the expected intraday movements. Although the VIX has been elevated for some time, last week saw a return to dangerous levels for equities. Once the VIX moves above 30 and continues higher, risk of sudden and substantial losses is elevated. The long-term VIX in more “normal” times is around 13. The VIX closed out last week at 38, a red flag level. Sometimes when the price of the market moves in a certain direction, the VIX and the volume levels do not confirm such movements. Price movements have more conviction when confirmed by volume and volatility.

Last week the S&P 500 and the Russell 2000 indices both fell close to 6%. These moves were confirmed by rising volatility and up volume on down days and down volume on up days. Throw in record high valuations, talk of increased global pandemic-related shutdowns, and a national election this week, and the amount of risk is excessive. Readers might be proclaiming, “But the market soared Monday!” True, that is what happens with a high VIX. Some of the largest up days occur with a high VIX, and often in a bear market. However, no matter how high the market soars on any particular day, the subsequent down days are typically greater.
With 75% of companies reporting, year-to-date earnings for the S&P 500 are down 40% compared to the first three quarters of 2019, according to the S&P Dow Jones Indices website. And even the inflated projections for 2021 remain 3% below 2019 earnings. The S&P 500 trailing 12-month price-to-earnings ratio is an astounding 34. So, it is obvious market prices are not factoring in the most important determinant of price…earnings. It is only the hope for more government stimulus, borrowed and paid for with Fed funny money, that is propping up prices. However, a VIX near 38 with accelerated volume on down days should give investors pause.

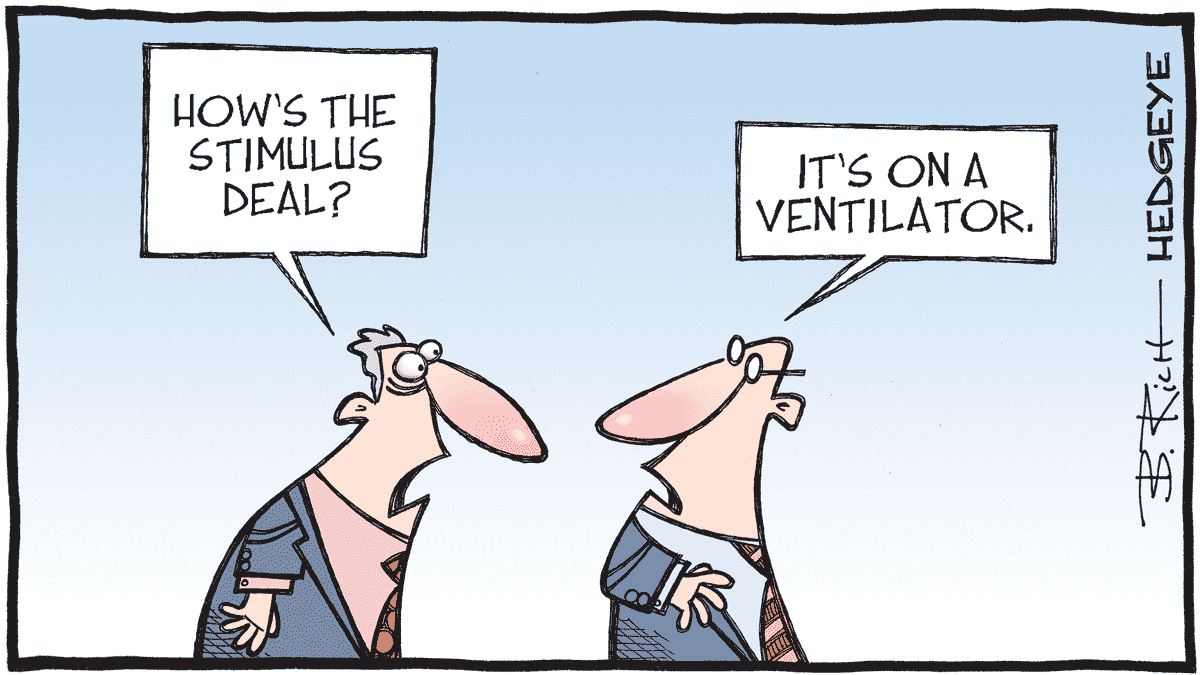
Additionally, the political parties have vastly different plans for how much more stimulus is needed and how it will be spent. Markets typically do not like uncertainty and there is no lack of it currently. One near-certainty is that with a VIX near 38, one can expect extreme short-term movements in markets over the week. The short-term direction is a coin toss, but in the long run there is not much question as to where prices need to go.
So, investors examining market action should expand beyond daily price movements and also assess volume and volatility. Buckle-up, its going to be an interesting week!
The S&P 500 Index closed at 3,270, down 5.6% for the week. The yield on the 10-year Treasury Note rose to 0.86%. Oil prices fell to $36 per barrel, and the national average price of gasoline according to AAA decreased to $2.13 per gallon.
© 2020. This material was prepared by Bob Cremerius, CPA/PFS, of Prudent Financial, and does not necessarily represent the views of other presenting parties, nor their affiliates. This information should not be construed as investment, tax or legal advice. Past performance is not indicative of future performance. An index is unmanaged and one cannot invest directly in an index. Actual results, performance or achievements may differ materially from those expressed or implied. All information is believed to be from reliable sources; however we make no representation as to its completeness or accuracy.
Securities offered through First Heartland Capital, Inc., Member FINRA & SIPC. | Advisory Services offered through First Heartland Consultants, Inc. Prudent Financial is not affiliated with First Heartland Capital, Inc.

