Executive Summary
In last week’s jobs report, did you hear that the unemployment rate increased slightly? Of course not, because you only hear the positive spin from financial media regarding the jobs numbers. In this week’s Update, I again share how the employment numbers are derived from two different surveys. Only after being run through a gamut of adjustments are the estimates released. They are truly estimated numbers based upon surveys, not hard data. As hard data becomes available, the previous estimates are revised based upon actual numbers. Below is my look “under the hood” at the details of the report accompanied by graphs. Excuse my cynicism, but the hype reported on financial media is not always supported by the details. Please proceed to The Details to see what I mean.
“The only thing more dangerous than ignorance is arrogance.”
– Albert Einstein
Last Friday, the Bureau of Labor Statistics (BLS) released the January Employment Situation report. And just like clockwork, the financial media cheerleading ensued. Regular readers of this newsletter know that I continually rail against the reporting from mainstream financial media. My overview of the employment report might shed some light on the incredible dearth of substance in financial media today.
Against every fiber of my being, I turned my television to financial media to witness the unveiling of the January report. And just as I suspected, the lack of in-depth examination quickly became apparent. The entire discussion and justification for their upcoming adjectives revolved around one number…the increase of 304,000 in nonfarm payrolls from the Establishment Survey. From this one number, I listened to numerous hosts and guests describe the “booming,” “blowout” jobs report “smashing” expectations and justifying any upward movement in the stock market. Imagine that, one number alone can result in such cheerleading.
I will attempt to delve into the Employment Situation report a little further to see if such incredible explanations make sense. A reasonable first impression of the 304,000 new jobs reported would indicate a decent job creation number. For a “blowout” number, one might expect something north of 500,000. It is important to realize this number was derived from the Establishment Survey and was not affected by the Government shutdown. Additionally, an adjustment was made to payroll employment numbers for November and December 2018. This adjustment reduced the previously reported job gains by a net 70,000, transforming a prior month reported “blowout” down to a below average jobs increase. But little attention was provided to this adjustment.
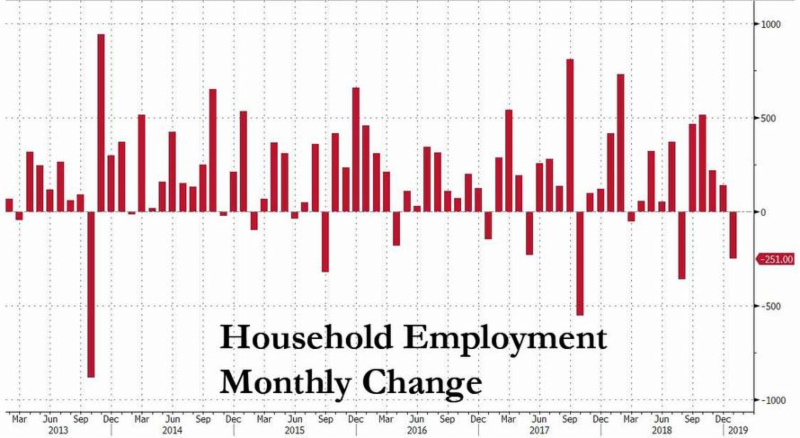
As explained in prior newsletters, the highly touted “unemployment rate” is generated from the Household Survey, not the survey used to report the new jobs number. The unemployment rate actually increased to 4.0%. But again, little mention. It is important to understand that these numbers are obtained from different surveys and scrubbed with numerous adjustments before hitting the airwaves. They are not “hard” numbers. For instance, the January Household Survey includes adjustments to prior year numbers resulting from newer more reliable data sources. These adjustments included a reduction in the total working age population by 800,000 people, and decreasing the number employed by 488,000 and the number listed as not in the labor force by 294,000.
After applying the above adjustments, the “seasonal” adjustments, and the “birth/death” adjustments, one has to wonder how much confidence can really be placed in this monthly number. The financial media seems to have all the confidence in the world…when it is a “good” number, never mind prior month revisions.
The “soft” survey data is not the same as actual payroll data. The following is from Bloomberg’s Andrew Cinko. Cinko “warns, we should probably brace ourselves for another big revision to the job-market data when February rolls around. That’s because the survey response rate for January was even lower than December’s woefully weak rate: consider that today’s report was based on a 60.7% response rate; December’s initial estimate was based on a 61.0% rate, which rose to 88.3% for today’s revised data.”
The following chart via Zero Hedge illustrates the change in employment numbers post survey adjustments.

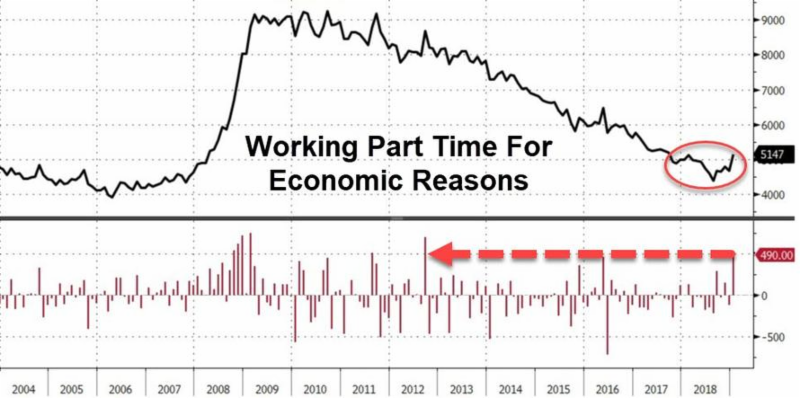
Keep in mind, the working age population typically grows by close to 200,000 people per month. Therefore, on average, it takes over 200,000 new jobs to begin to impact previously unemployed individuals. Another important factor is the number of full-time versus part-time workers. The Household Survey showed a huge upswing in individuals working part-time for economic reasons. This data could be the result of the Government shutdown. If so, this could reverse back down next month.

Average hours worked were practically unchanged, and average hourly earnings for private-sector production and nonsupervisory employees increased nominally by 3 cents to $23.12.
Overall, the jobs report could be considered average at best. Considering the number of estimates and adjustments included, it is necessary to understand the numbers are rough estimates. How the media can turn this report into a “blowout,” “booming” jobs report confuses me. If you find yourself turning to mainstream financial media for business and stock market information, please realize what you are getting…cheerleading, not independent analysis.
The S&P 500 Index closed at 2,707 up 1.57% for the week. The yield on the 10-year Treasury note fell to 2.69%. Oil prices increased to $55 per barrel, and the national average price of gasoline according to AAA remained at $2.26 per gallon.
At Cremerius Wealth Management, portfolios are developed to take into account the state of the economy, market cycle and valuation, and relative strength. Our goal is long-term growth with limited downside potential. If you need assistance with your portfolio, please give me a call. I would be happy to review your situation and explain how we can help you work towards achieving your goals.
Best Regards,
Bob Cremerius, CPA/PFS
© 2019. This material was prepared by Bob Cremerius, CPA/PFS, of Cremerius Wealth Management, and does not necessarily represent the views of other presenting parties, nor their affiliates. This information should not be construed as investment, tax or legal advice. Past performance is not indicative of future performance. An index is unmanaged and one cannot invest directly in an index. Actual results, performance or achievements may differ materially from those expressed or implied. All information is believed to be from reliable sources; however we make no representation as to its completeness or accuracy.
Securities offered through First Heartland Capital, Inc., Member FINRA & SIPC. | Advisory Services offered through First Heartland Consultants, Inc. Cremerius Wealth Management is not affiliated with First Heartland Capital, Inc.
Want to learn more about our Insurance strategies?
Set up a time to chat with us.

