Executive Summary
If you do not have time to read the entire Weekly Market Update, looking at the first chart is a must. The data points, the direction, rate of change and trend columns are somewhat alarming. The next two graphs show data regarding manufacturing and service sectors. And finally, the current economic outlook from Federal Reserve models. One must recognize that the financial industry and the media covering the financial industry have some inherent biases. For the media, positive economic outlooks are more entertaining and sell better, which also is the case for the financial industry. Recessionary outlooks based on real data points are provided for our readers to stay informed. Please proceed to The Details.
“In God we trust, all others must bring data.”
— W. Edwards Deming
The Details
Lately, I have written that the U.S. economy could be in or near a recession. In this Update, I will share some data to indicate why I believe that to be the case. The Institute for Supply Management (ISM) is a leader in supply management research and publishes a widely utilized Manufacturing Report On Business®. According to their website, the ISM
“is one of the most reliable economic indicators available. Published monthly since 1931, the report includes the Purchasing Managers Index (PMI), developed in 1982 with the U.S. Department of Commerce, which measures new orders, production, employment and supplier deliveries.”
A PMI result above 50 indicates expansion and below 50 denotes contraction. Contraction readings often, but not always, coincide with recessions. Below is a breakdown of the latest manufacturing report obtained from Mish Shedlock of Mish Talk. The overall index revealed contraction for the second month in a row in September. This was the worst reading since June 2009.
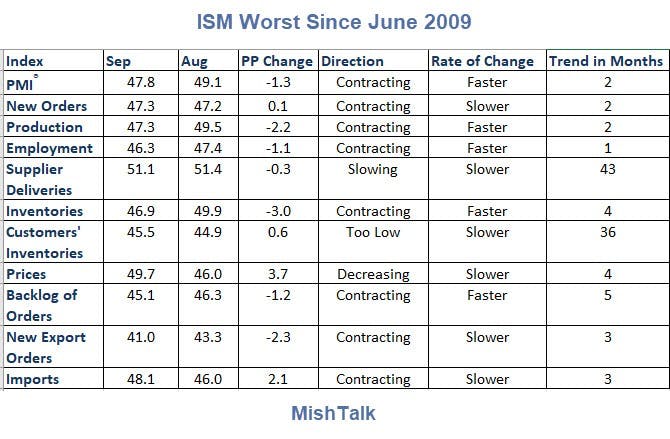
Notice the Employment component of the index decreased in September to 46.3 from 47.4. This corresponds with the September jobs report which indicated a loss of 2,000 manufacturing jobs.
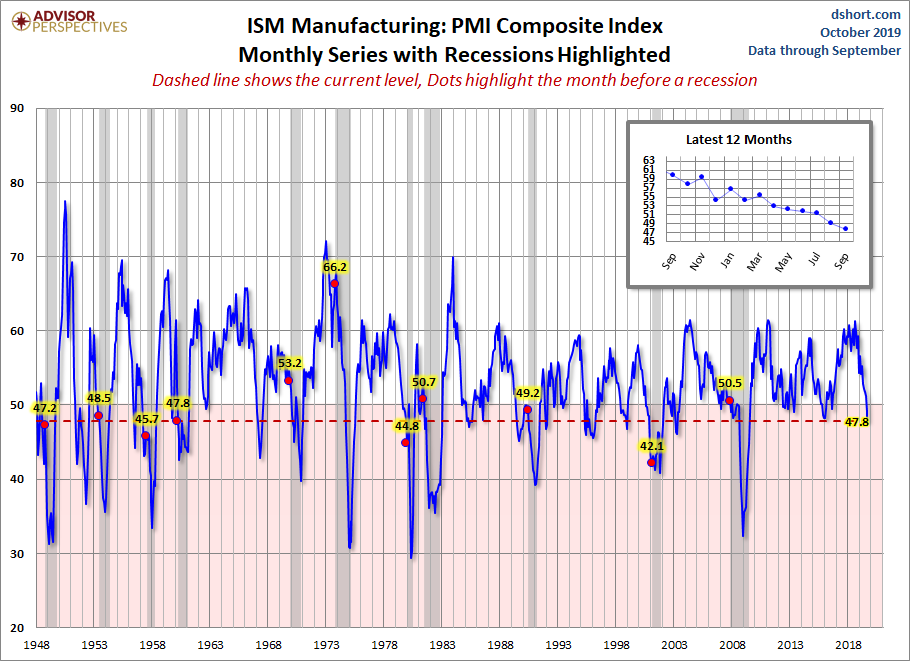
Below is a graph of the ISM PMI report from Advisor Perspectives. Recession periods are highlighted in gray. The red dots indicate the month before a recession was declared. The current PMI of 47.8 is well into contraction mode and is below the level at the start of the Great Recession.
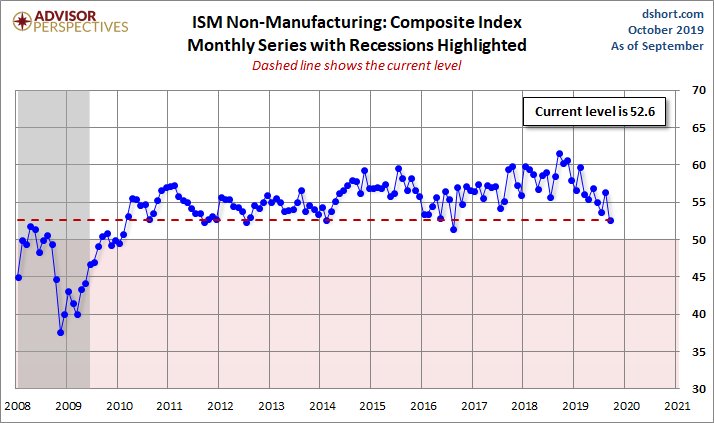
The ISM also prepares an index for the non-manufacturing or service sector. The service sector represents a much larger portion of our economy. The current level of the non-manufacturing index dropped to 52.6. While still slightly at expansion levels, it is close to falling to contraction.
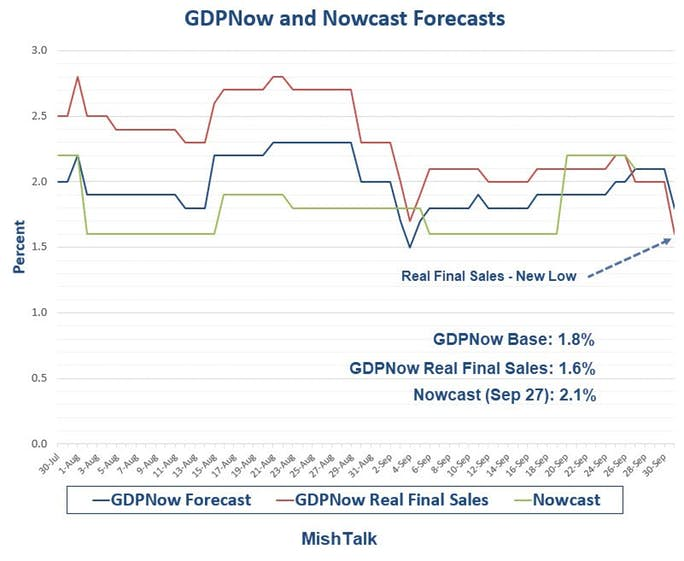
As one would expect with contractionary manufacturing readings and a near-contractionary service sector, the outlook for real GDP growth is decreasing. The following chart from Mish Talk shows the declining forecasts for third quarter 2019 GDP and real final sales. The current GDPNow forecast from the Atlanta Fed is 1.8%. Some readers might be thinking this is a low number, but it is not negative, therefore not indicative of a recession. It is important to note that reported economic numbers go through a series of revisions. In order to provide quick results, it is normal for certain data to be estimated. It is common for subsequent data revisions to reveal a recession started up to a year prior to the data revision date.
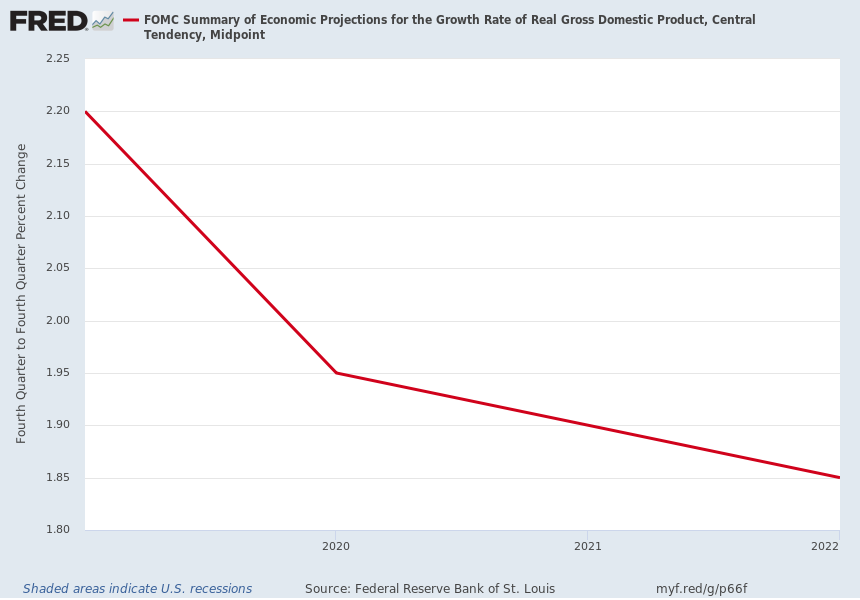
Even without the call for a recession, the Fed’s FOMC (Federal Open Market Committee) is projecting extremely slow economic growth in the future, as can be seen in the chart below. A recession over the next year would only make these projections look worse.
The ISM results are just one source of data. There are many other corroborating datapoints leading to the conclusion that a current or near-term recession is highly possible. When determining the status of the economy, it is critical to examine the underlying data. Recognize that relying on financial pundits who often come with inherent biases could be dangerous.
The S&P 500 Index closed at 2,952 down 0.33% for the week. The yield on the 10-year Treasury fell to 1.52%. Oil prices decreased to $53 per barrel, and the national average price of gasoline according to AAA remained at $2.65 per gallon.
© 2019. This material was prepared by Bob Cremerius, CPA/PFS, of Prudent Financial, and does not necessarily represent the views of other presenting parties, nor their affiliates. This information should not be construed as investment, tax or legal advice. Past performance is not indicative of future performance. An index is unmanaged and one cannot invest directly in an index. Actual results, performance or achievements may differ materially from those expressed or implied. All information is believed to be from reliable sources; however we make no representation as to its completeness or accuracy.
Securities offered through First Heartland Capital, Inc., Member FINRA & SIPC. | Advisory Services offered through First Heartland Consultants, Inc. Prudent Financial is not affiliated with First Heartland Capital, Inc.
Want to learn more about our Insurance strategies?
Set up a time to chat with us.

