Executive Summary
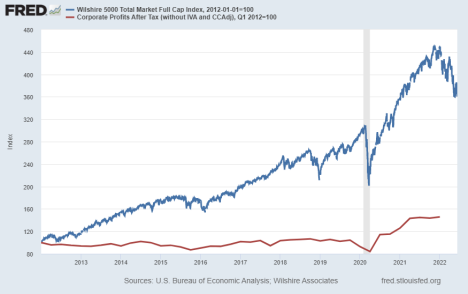
The S&P 500 Index hit technical bear market territory Monday, June 13, falling below 20% year-to-date. Such large drops have many investors and pundits already attempting to pick the bottom and recommending buying-the-dip. However, this time the Fed is in a tightening policy which eliminates the Fed put many have believed in for the last twelve years. In addition to the Fed policy blowing the market bubble, the use of margin debt to leverage investor profits has contributed to the bubble (see third graph). When margin debt gets called due to falling stock prices, it accelerates market selling. Understanding the anatomy of a bubble will also be helpful at this time (see last graph). The disconnect between corporate profits (first graph) and the overall stock market overvaluation (fourth graph) gives a visual of how much further markets could fall without significant Fed and government intervention. Be cautious out there.
Please proceed to The Details.
“The history of markets is one of overreaction in both directions.”
–Peter Bernstein
The Details
Since the Financial Crisis starting in 2007, the Federal Reserve Bank (Fed) increased its balance sheet by $8 trillion. This massive increase combined with an increase in the Federal debt of around $21 trillion over this period, fueled the largest stock market bubble in history. Over the past decade, I have written numerous newsletters explaining how the increase in the stock market was primarily due to “multiple expansion.” Multiple expansion merely means that stock prices are rising much faster than corporate earnings. This results in a larger Price-to-Earnings (P/E) Ratio. Notice in the graph below, the price of the Wilshire 5000 Total Market Cap Index versus the increase in corporate earnings since 2012. The gap has merely gotten larger.
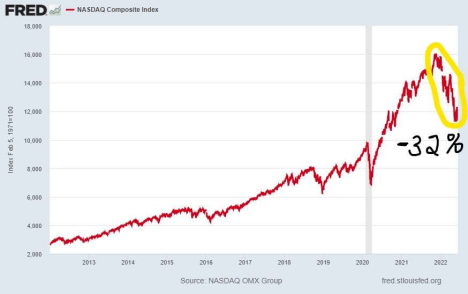
This year, investors have experienced the beginning of a bear market as stock prices fall. The S&P 500 Index peaked at the end of 2021 and has been falling ever since. The largest individual stock price drops so far have been in the large speculative and FANG corporate names such as: Facebook (Meta), Netflix, Amazon and others. However, recently corporations such as Walmart and Target have been hit as earnings outlooks decline. Notice in the graph below of the Nasdaq which includes most of the high-flyers, the Index has fallen about 32% since its top.
The S&P 500 Index hit technical bear market territory Monday, June 13, falling below 20% year-to-date. Such large drops have many investors already attempting to pick the bottom and recommending buying-the-dip. Many of these investors have never experienced a bear market and have not studied market history. They have been trained to believe that if the stock market falls, the Fed will loosen monetary policy – or at least stop tightening – so the stock market will revert back to its “normal” state of always increasing.
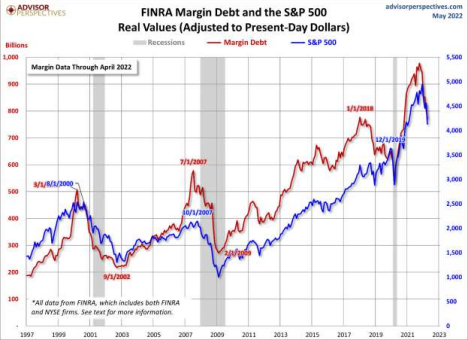
This market bubble, like those before it, was greatly fueled by margin debt. Once investors came to the conclusion that the market only rises, they determined using leverage could greatly increase their profits. Although margin has decreased slightly as of late, notice in the graph below that on an inflation adjusted basis, margin debt is higher today than during any previous bubble. Investors are soon to learn the downside of using leverage to buy stocks.
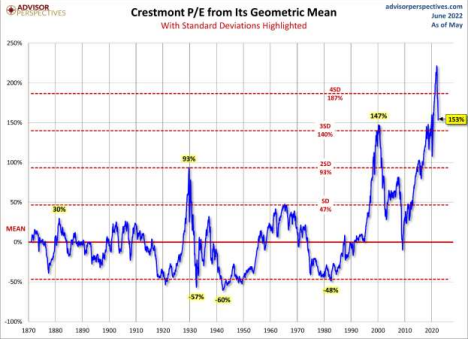
Without the understanding of historical valuations and market cycles, and after over a decade of Fed-pumped markets, it is easy to see how investors might believe after a 20-30% pullback in markets, a “bottom” might be close. However, those who understand history and valuations realize that this market remains far from the ‘bottom.” According to the Crestmont P/E shown in the graph below (a derivation of the Cyclically Adjusted P/E, PE10 or Shiller P/E), the market remains over three standard deviations above the long-term mean. Statistically, this only occurs 0.3% of the time. According to the calculation, the market remains 153% above the mean. That implies the S&P 500 would have to fall another 60.5% just to return to the mean. But, since the market has remained above the mean for decades, it would seem reasonable, based upon historical cycles, for the market to fall and remain below the mean for some period of time. That is something that has not occurred since the 1970’s. To fall below the mean would require an even greater plunge.
It could take over a year for the stock market to sell-off to the mean level or below. During this time investors who used margin will receive margin calls forcing them to sell more stock to meet these calls, thus exerting more downward pressure on markets. This leads to investor capitulation and panic when investors feel they must sell to preserve what they have left. By this time, investors reach a point of despair, where they have no interest in purchasing stocks.
The mere fact that some investors are attempting to call a bottom and encourage buying-the-dip reveals that investors are no where near the bottom. This is confirmed by the level of current valuations.
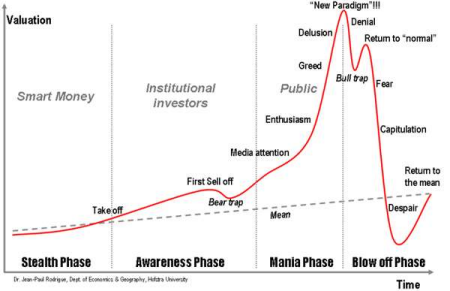
As investors enter the “Fear” stage of a market bubble, it is expected they would hope things turn around. This hope is expressed with confidence by those who have never invested through a complete market cycle. Bottom picking will not reveal the results they desire. It is important now that investors understand the anatomy of a bubble, combined with current valuations and market activity.
None of this is to say the Fed or Federal government will not attempt to change policy to try and “save” the stock market. However, the Fed is backed into a corner trying to control inflation in a slowing economy. It is questionable whether their actions will have the desired effect on inflation. The Fed is meeting this week and will reveal their current thinking. As of now, the plan is more tightening, which will continue to exert downward pressure on both the economy and the stock market. Caution is warranted.
The S&P 500 Index closed at 3,901, down 5.1% for the week. The yield on the 10-year Treasury Note rose to 3.16%. Oil prices rose to $121 per barrel, and the national average price of gasoline according to AAA increased to $5.01 per gallon.
© 2022. This material was prepared by Bob Cremerius, CPA/PFS, of Prudent Financial, and does not necessarily represent the views of other presenting parties, nor their affiliates. This information should not be construed as investment, tax or legal advice. Past performance is not indicative of future performance. An index is unmanaged and one cannot invest directly in an index. Actual results, performance or achievements may differ materially from those expressed or implied. All information is believed to be from reliable sources; however we make no representation as to its completeness or accuracy.
Securities offered through First Heartland Capital, Inc., Member FINRA & SIPC. | Advisory Services offered through First Heartland Consultants, Inc. Prudent Financial is not affiliated with First Heartland Capital, Inc.

