Executive Summary
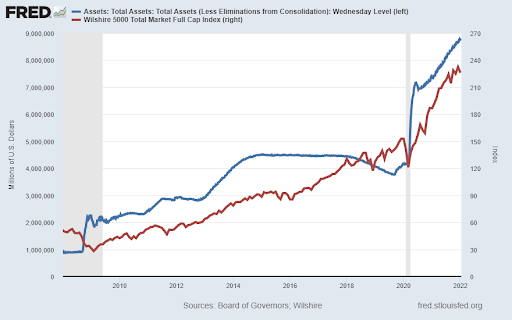
In 2008 to combat the Great Recession, the Fed instituted a new program called Quantitative Easing (QE) in which they purchased Treasury Securities and Agency mortgage-backed securities. To pay for the purchases of these debt securities, the Fed credited the reserve accounts of the sellers. Because of the correlation between the Fed’s total assets and the stock market (graph 1 below), some believe the funds flowed directly into stocks. In reality, there is no direct “funnel” from the Fed to the market; however, the fact that the Fed is massively increasing the monetary base led investors to believe the market would only go up. In addition to purchasing close to $8 trillion in securities, the Fed lowered short-term interest rates via the Federal Funds rate to close to zero percent. At this point, the Fed has painted itself into a corner. The Fed Funds rate remains near zero and QE continues albeit at a lower level, while growth is expected to slow, and inflation is at a level not seen in 40 years. Please read The Details below to learn more about the predicament the Fed is in today and what could end up being the results of their actions.
Please proceed to The Details for an explanation of the relationships to watch moving forward.
“Inflation is an increase in the quantity of money without a corresponding increase in the demand for money, i.e., for cash holdings.”
–Ludwig von Mises
The Details
Just prior to the start of the Great Recession in December 2007, the assets of the Federal Reserve Bank (Fed) totaled about $800 billion. In order to combat the recession, the Fed instituted a new program called Quantitative Easing (QE) in which they purchased Treasury Securities and Agency mortgage-backed securities. To pay for the purchases of these debt securities, the Fed credited the reserve accounts of the sellers. The purchased securities became assets on the Fed’s balance sheet and the increase in the reserve accounts increased the monetary base. There is much confusion, even among professional advisors, as to what the result has been of increasing the selling institutions’ reserve accounts with Fed-created “money.” Because of the correlation between the Fed’s total assets and the stock market, some believe the funds flowed directly into stocks. In reality, there is no direct “funnel” from the Fed to the market; however, the fact that the Fed is massively increasing the monetary base led investors to believe the market would only go up. Over the past 14 years, the Fed increased its balance sheet by a whopping $8 trillion. See the graph below showing Fed assets in blue and the Wilshire 5000 (total market) index in red.

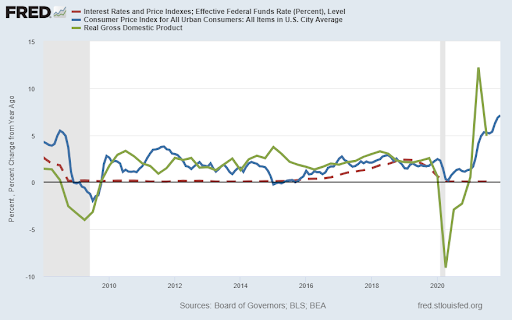
The biggest portion of Fed purchased securities occurred after the start of the pandemic in 2020. Notice the blue line in the graph above has turned almost vertical since 2020. In addition to purchasing close to $8 trillion in securities, the Fed lowered short-term interest rates via the Federal Funds rate to close to zero percent (dashed red line in graph below). One would think with such extreme monetary policy actions, that economic growth would have soared. Instead, growth between the Great Recession and the pandemic remained almost one-third below prior long-term trend growth. When the pandemic hit, growth plummeted. The Fed and Federal Government responses were dramatic. Therefore, real GDP growth plunged and then surged temporarily higher (shown in green in the graph below.) Now, with the stimulus gone, growth is again falling back towards the pre-pandemic subpar trend.
The reason for the below-trend economic growth, despite unprecedented monetary policy, is due to the amount of total debt in the economy. According to Hoisington Investment Management, in 2020 U.S. total debt-to-GDP hit a record of 407%! And trillion-dollar plus deficits appear to be the “normal” for the future. This incredible amount of debt represents a significant drag on economic growth. At the same time, the massive growth in the monetary base and money supply, combined with supply chain troubles, have led to a recent surge in inflation (blue line in graph below).

At this point, the Fed has painted itself into a corner. The Fed Funds rate remains near zero and QE continues albeit at a lower level, while growth is expected to slow, and inflation is at a level not seen in 40 years. The Fed has held-off raising interest rates for fear of popping the enormous bubble in the stock market. Normally, the Fed would raise rates to keep the economy from overheating which could lead to inflation. Inflation today is not due to an overheating economy. It is due to over a decade of absurd monetary policy, massive Federal deficits and supply chain problems.
The Fed has indicated they will end QE by March 2022. Additionally, they stated they plan to raise the Fed Funds rate at least three times this year. Morgan Stanley believes it will be more like four hikes in 2022. And now the Fed has hinted that not only will they stop purchasing bonds (QE), but they could start to reduce their balance sheet this year by allowing maturing bonds to roll-off.
In other words, the Fed is planning to tighten policy, both interest rates and QE, at the same time the economy is slowing. This could be a recipe for disaster for a stock market priced over three times the level justified by revenue and earnings. The Fed’s dilemma is how to decrease inflation without further slowing economic growth and popping the stock market bubble.
The Fed recognizes they are behind the game in raising interest rates and fear the horse has left the barn. The fact that debt-to-GDP is at an all-time high, reveals that any increase in interest rates will have a deleterious effect on economic growth. As usual, the Fed seems to be behind the curve. As such they will do too much too late. Time will reveal the negative impact this has on both economic growth and the stock market. It’s a long way down to the mean!
The S&P 500 Index closed at 4,663 down 0.3% for the week. The yield on the 10-year Treasury Note rose to 1.79%. Oil prices increased to $84 per barrel, and the national average price of gasoline according to AAA rose to $3.31 per gallon.
© 2022. This material was prepared by Bob Cremerius, CPA/PFS, of Prudent Financial, and does not necessarily represent the views of other presenting parties, nor their affiliates. This information should not be construed as investment, tax or legal advice. Past performance is not indicative of future performance. An index is unmanaged and one cannot invest directly in an index. Actual results, performance or achievements may differ materially from those expressed or implied. All information is believed to be from reliable sources; however we make no representation as to its completeness or accuracy.
Securities offered through First Heartland Capital, Inc., Member FINRA & SIPC. | Advisory Services offered through First Heartland Consultants, Inc. Prudent Financial is not affiliated with First Heartland Capital, Inc.

