Executive Summary
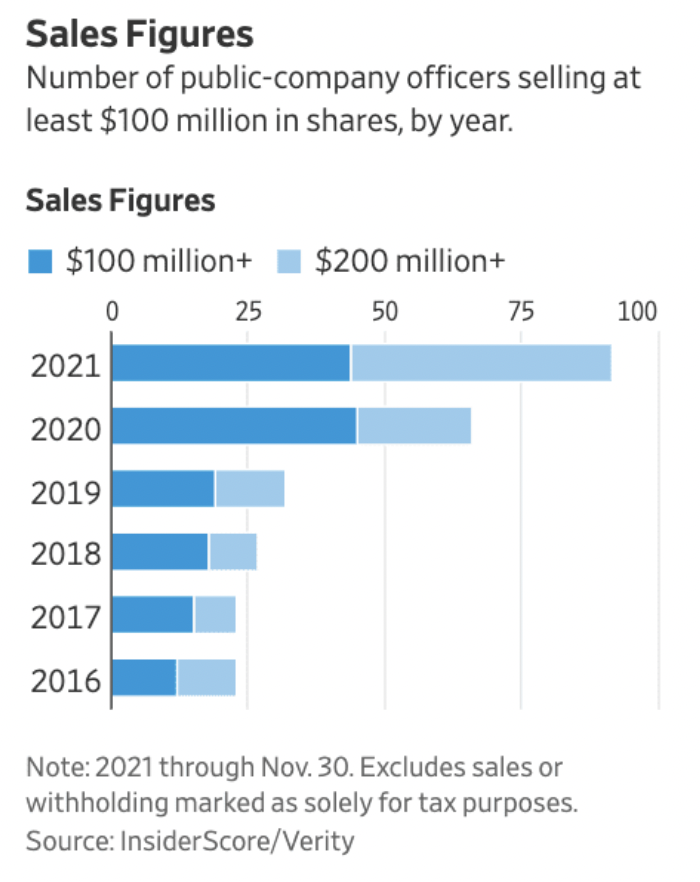
Corporate profit margins are being squeezed by upward wage pressure and downward productivity, all while stock prices are rising. The second graph below of the Wilshire 5000 Index divided by GDP shows bubble values which are almost 50% higher than the peak of the 2000 Tech Bubble. The price to sales ratio (a less manipulated statistic) confirms bubble pricing (third graph). And the last two graphs show how corporate insiders are selling stock – to the tune of $63.5 billion through November of this year. Insiders see the data and are selling, so who will be left holding the bag?
Please proceed to The Details for an explanation of the relationships to watch moving forward.
“Congratulations. I knew the record would stand until it was broken.”
–Yogi Berra
The Details
Inflation has added a significant burden on producers’ input prices. Additionally, corporations are feeling the pressure to raise wages. At the same time, productivity (output per hour) just plunged. In the third quarter, labor productivity had its worst quarter in over 60 years. What happens to profit margins when productivity falls, and wages increase? Notice in the graph below the drop in productivity (red line – left hand side) and the jump in hourly wages (blue line – right hand side).

Unfortunately, investors are not really paying attention to such details. Fundamentals such as sales and profits are of no concern to most investors. A quick look at how absurd pricing has become can be seen in the following graphs. First, the Wilshire 5000 Index market cap divided by GDP is higher, by a long shot, than ever before. In fact, as shown in the following graph, it is currently priced almost 50 percent higher than the TOP of the Technology Bubble in 2000. The Technology Bubble was previously the most overvalued bubble in history – not any longer.

And if the graph above is not emphatic enough, the chart below illustrating global price-to-sales ratios provides confirming evidence. Again, this shows the U.S. price-to-sales ratio massively above the Technology Bubble level.

At the same time the stock market is priced at untenable levels, inflation remains high, profit margins being squeezed, and this week the Fed could announce an acceleration of their tapering of QE. And, although the major market indexes might be up, they are being propped up by fewer and fewer companies. The Russell 3000 Index comprises about 98% of all U.S. listed stocks. Almost half of the individual components of the Russell 3000 are down 20% or more.
Apparently, the ones who understand the facts the best, corporate insiders, realize what is happening. According to an article on Zero Hedge, “InsiderScore data shows corporate insiders sold a mindboggling $63.5 billion in shares through November, a 50% jump versus all of 2020.”

The data is there for everyone to see. The insiders see it. Many speculators believe this time will be different. A purview of history shows this is a common theme near the end of bubbles. The graph of the Wilshire 5000 (total market) Index to GDP above is clear. The market has reached insane levels. Who will be left holding the bag?
The S&P 500 Index closed at 4,595 up 2.5% for the week. The yield on the 10-year Treasury Note rose to 1.49%. Oil prices increased to $72 per barrel, and the national average price of gasoline according to AAA dropped to $3.33 per gallon.
© 2021. This material was prepared by Bob Cremerius, CPA/PFS, of Prudent Financial, and does not necessarily represent the views of other presenting parties, nor their affiliates. This information should not be construed as investment, tax or legal advice. Past performance is not indicative of future performance. An index is unmanaged and one cannot invest directly in an index. Actual results, performance or achievements may differ materially from those expressed or implied. All information is believed to be from reliable sources; however we make no representation as to its completeness or accuracy.
Securities offered through First Heartland Capital, Inc., Member FINRA & SIPC. | Advisory Services offered through First Heartland Consultants, Inc. Prudent Financial is not affiliated with First Heartland Capital, Inc.

