Executive Summary
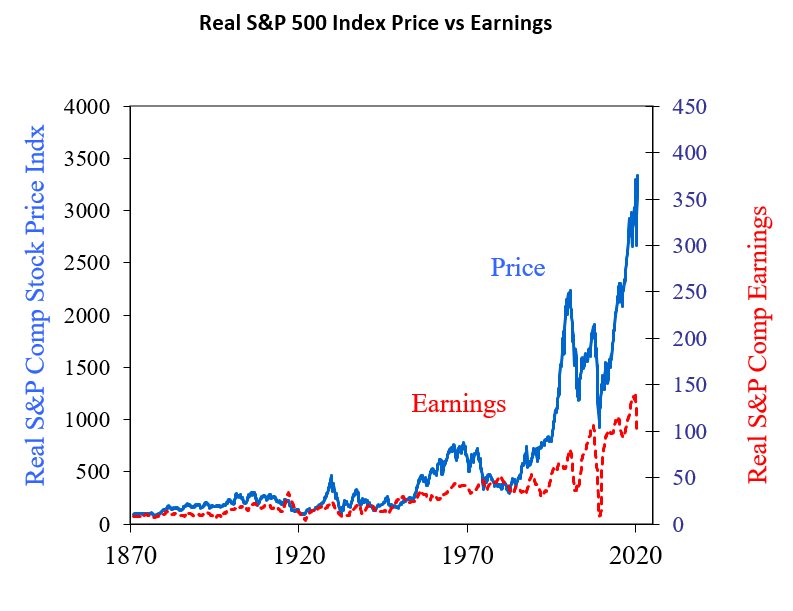
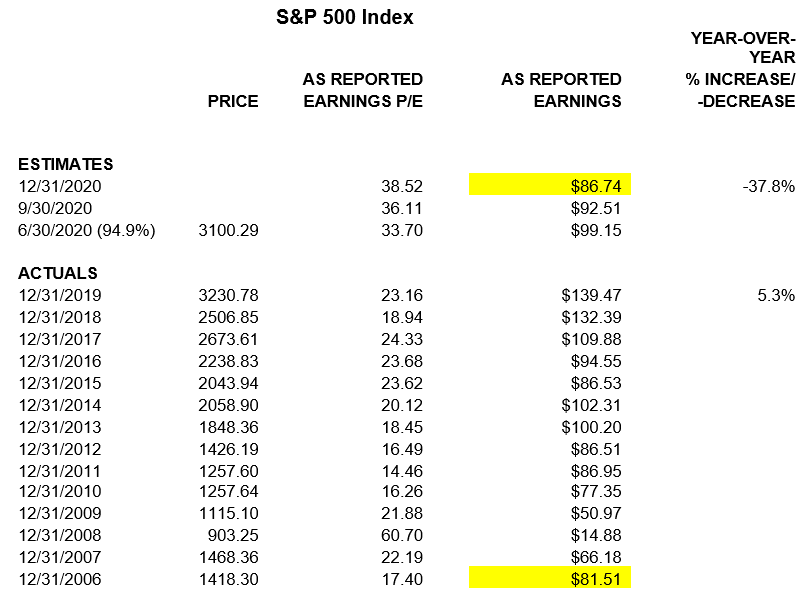
Public companies are required to publish financial statements in accordance with Generally Accepted Accounting Principles (GAAP). However, if GAAP earnings do not provide the picture stock analysts want, then they shift to alternatives such as “adjusted” earnings, operating earnings or projected future earnings. The financial media and Wall Street analysts both do this to report only positive numbers instead of merely reporting the facts in a comparable manner intended by GAAP. The first graph below, prepared by Yale professor Robert Shiller, illustrates the long-term S&P 500 inflation-adjusted stock prices versus earnings. The disconnect between stock prices and fundamental (GAAP) earnings is very evident. The S&P 500 earnings data in the second chart below indicates that the combination of a slowing economy pre-COVID-19 with the economic impact of the pandemic has been devastating to corporate earnings during 2020. Net GAAP earnings for 2020 are now expected to drop by about 38% compared to the prior year. Based upon 2020 earnings, the Price/Earnings ratio is expected to be about 38.52. While I do expect earnings to recover ground in 2021, the extent is up in the air.
Please proceed to The Details for more on how positive earnings reports may not be what is reflected in the fundamental data or GAAP financial statements.
“Plan ahead…It wasn’t raining when Noah built the Ark.”
–Mario Gabelli
The Details
Although in the short-run the stock market typically pays little attention to fundamental data such as corporate earnings, in the long-run earnings matter. Therefore, Wall Street analysts and prognosticators always try to put a positive spin on the earnings picture. If one wants to understand a company’s financial situation, an examination of its audited financial statements should provide the most accurate numbers. There is a reason public companies are required to publish financial statements in accordance with Generally Accepted Accounting Principles (GAAP). However, if GAAP earnings do not provide the picture analysts want, then they shift to the alternatives. Whatever paints the rosiest picture in attempts to boost the stock price ends up being the preferred reporting number. These include, “adjusted” earnings which typically add back certain “one-time” hits to earnings, operating earnings because they should be higher than net earnings, and of course projected future earnings. Because whatever might be reducing current net earnings certainly will not last for long.
It has gotten so bad that if you were to look for audited net earnings in media reports during earnings reporting season, you might have to do an intensive search. I have noticed most of the mainstream financial media report only “adjusted” and forecasted earnings. It is almost like financial media are in bed with Wall Street analysts. At a minimum, they both are trying to report only numbers which put a positive spin on the results, instead of merely reporting the facts.
Even though the stock market became disconnected from earnings a long time ago, as always occurs during stock market bubbles, it is wise to understand what the fundamental earnings picture looks like, especially the audited net earnings GAAP numbers. So, let’s dig into earnings and look at some visuals.
First, let’s look at a very long-term graph of S&P 500 inflation-adjusted prices versus earnings, prepared by economist and Yale professor Robert Shiller. (Note: This graph is not prepared on a logarithmic scale; therefore, it does not highlight the rate of change in the data.) It does not take an extensive examination of this graph to see the historical gap between current prices versus earnings.
The S&P 500 earnings data in the chart below was obtained from the S&P Dow Jones Indices website. The combination of a slowing economy pre-COVID-19 with the economic impact of the pandemic has been devastating to corporate earnings during 2020. “As reported,” which represent net GAAP earnings, for 2020 are now expected to drop by about 38% compared to the prior year. Stunningly, the plunge in S&P 500 earnings is likely to push earnings-per-share for 2020 to about $86.74. This is only 6% (not annualized) above the net earnings from 2006 about 15 years earlier. And another important figure is the estimated price-to-earnings ratio (P/E). Based upon 2020 earnings, the P/E is expected to be about 38.52. The only time this ratio was higher was after earnings had plunged during the two previous bear markets.
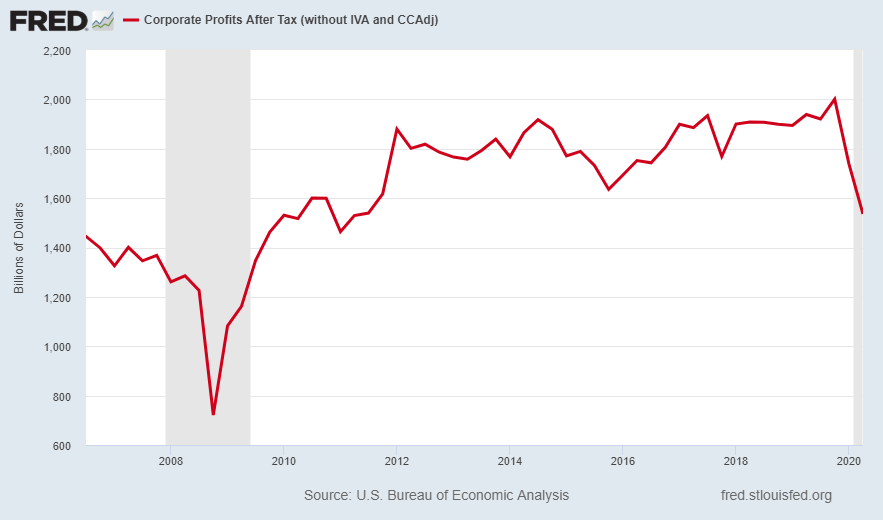
Expanding corporate earnings beyond the S&P 500 companies, the following graph from the St. Louis Fed FRED database highlights the plunge (through Q2) in corporate earnings. The current earnings results are below that of 2012 and, consistent with the S&P 500, are about 6% higher than that from 2006.
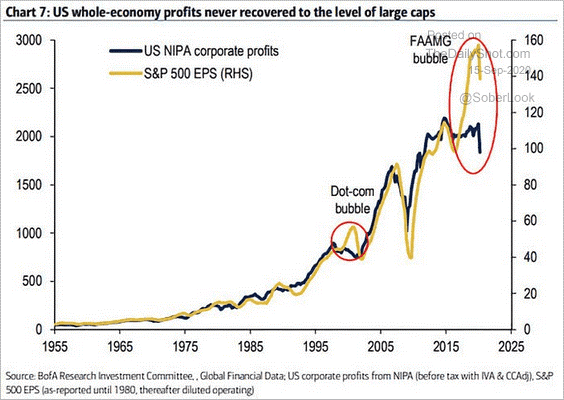
The following graph illustrates the enormous gap between these corporate earnings and the S&P 500 Index. Notice the current gap relative to the Tech Bubble peak in 2000.
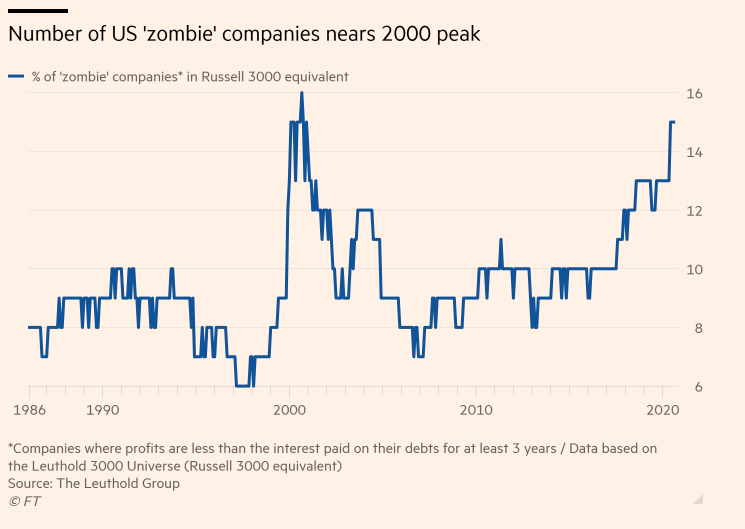
One more graph highlighting the disconnect between stock prices and earnings, the following shows the number of companies from the Leuthold 3000 Universe (Russell 3000 equivalent) which are reporting profits less than the interest paid on their debts for at least three years. The number of these zombie companies is close to the 2000 bubble peak, but the result is actually worse because interest rates have been so much lower over the past three years compared to 2000. This indicates the debt balances must be much higher today.
While I do expect earnings to recover ground in 2021, the extent of the recovery is still up in the air. It depends upon how controlled COVID-19 is, how much debt is incurred during the interim, how much additional stimulus is provided, how many job losses become permanent among a number of other factors. Of course, the major wirehouses are already providing unbelievably optimistic projections, which are not consistent with the facts as they exist today. But they are consistent with their number one goal, to pump the stock market higher and for as long as possible. The problem with this aspiration is the end result is always similar, just look back to 2000-2002 and 2007-2009.
The next time you see an article published describing corporate earnings by one of the Wall Street firms or the financial media, I encourage you to pay attention to the “type” of earnings described. Is it “adjusted,” “operating” or “projected?” Then, if you have the time, look up GAAP earnings for comparison. The results might surprise you.
The S&P 500 Index closed at 3,341 down 2.5% for the week. The yield on the 10-year Treasury Note fell to 0.67%. Oil prices decreased to $37 per barrel, and the national average price of gasoline according to AAA dropped to $2.20 per gallon.
© 2020. This material was prepared by Bob Cremerius, CPA/PFS, of Prudent Financial, and does not necessarily represent the views of other presenting parties, nor their affiliates. This information should not be construed as investment, tax or legal advice. Past performance is not indicative of future performance. An index is unmanaged and one cannot invest directly in an index. Actual results, performance or achievements may differ materially from those expressed or implied. All information is believed to be from reliable sources; however we make no representation as to its completeness or accuracy.
Securities offered through First Heartland Capital, Inc., Member FINRA & SIPC. | Advisory Services offered through First Heartland Consultants, Inc. Prudent Financial is not affiliated with First Heartland Capital, Inc.

