Executive Summary
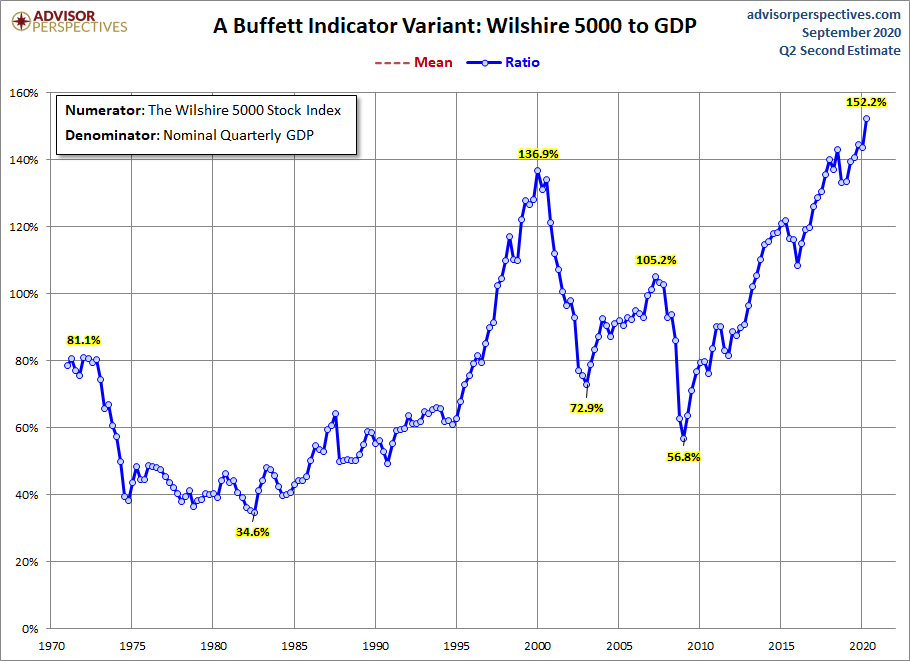
Last month the stock market, especially the technology-heavy NASDAQ 100 Index, reflected extreme investor exuberance reminiscent of the Technology Bubble peak in 2000. There is an old saying: the stock market rises like and escalator and falls like an elevator. The recent stock split announcements from Tesla and Apple, combined with excess exuberance, and fed by an enormous amount of derivative trades pushed stock markets, especially the NASDAQ 100, almost straight up. The derivative trades involving call options, as explained in The Details, created a circular process driving stock prices higher. Now as stock indices are at or near all-time records, corporate earnings are falling. The graph below from Advisor Perspectives shows the Buffett Indicator with stocks more overvalued than ever before in history. Also included is a reflection on similarities to Sun Microsystems during the Technology Bubble. The risk of an elevator drop appears high.
Please proceed to The Details.
“If you die in an elevator, be sure and push the up button.”
–Anonymous
The Details
Last month the stock market, especially the technology-heavy NASDAQ 100 Index, reflected extreme investor exuberance reminiscent of the Technology Bubble peak in 2000. There is an old saying: the stock market rises like and escalator and falls like an elevator. It appears lately as if investors were attempting to change the saying to: the stock market rises like an elevator…period. The end of last week and through today, Tuesday, many investors learned that elevators do go down. The NASDAQ 100 plunged 11% in three trading days.
Recently two extremely large capitalization stocks, Tesla and Apple, announced stock splits. It seems that many investors are not quite sure how a stock split works because they sent these stock prices through the ceiling after the announcements. In reality, a stock split merely divides the number of shares and the share price into smaller bite-size pieces. In no way does it increase the value of a company. The stock split announcements, combined with excess exuberance, and fed by an enormous amount of derivative trades pushed stock markets, especially the NASDAQ 100, almost straight up. The thing about stocks and stock market indices that go straight up is they do not tend to rise ad infinitum. History shows that the more vertical the ascent, the more the reversal tends to be an inverse mirror image.
As mentioned, much of the recent impetus was the result of derivative trades. Simply stated, a large number of call options were purchased. A call option gives the purchaser the right to buy a particular stock at a stipulated strike price. The purchaser hopes the stock will rise and can then execute the option to buy the stock at the lower strike price. To hedge against the call risk, dealers purchased the actual shares so they would be available to sell to the option holders. This activity pushes these stock prices higher, thus incentivizing more investors to purchase more call options, resulting in more of the stock being purchased. This circular process continued until it broke last Thursday.
At the same time stock indices are at or near all-time records, corporate earnings are falling. The result is a higher price-to-earnings ratio or paying more money for less earnings. The graph below from Advisor Perspectives shows the Buffett Indicator. This methodology compares the market price of all stocks to GDP. Currently this indicator is showing stocks more overvalued than ever before in history.

An even more revealing indicator of valuation is Price-to-Sales (P/S). Sales are a less manipulated number and provide a consistent basis for determining value. The long-term average P/S ratio for the S&P 500 is around 1. The current P/S ratio is about 2.4.
The following excerpt is from economist Lance Roberts’ blog at Real Investment Advice.
“While most young investors today assume ‘buying value’ is for ‘boomers,’ it is worth remembering what Scott McNealy, then CEO of Sun Microsystems, told investors who were paying 10x Price-to-Sales for his company in a 1999 Bloomberg interview.
‘At 10-times revenues, to give you a 10-year payback, I have to pay you 100% of revenues for 10-straight years in dividends. That assumes I can get that by my shareholders. It also assumes I have zero cost of goods sold, which is very hard for a computer company.
That assumes zero expenses, which is hard with 39,000 employees. That assumes I pay no taxes, which is very hard. And that expects you pay no taxes on your dividends, which is kind of illegal. And that assumes with zero R&D for the next 10-years, I can maintain the current revenue run rate.
Now, having done that, would any of you like to buy my stock at $64? Do you realize how ridiculous those underlying assumptions are? You don’t need any transparency. You don’t need any footnotes.
What were you thinking?’”
The stock price of Sun Microsystems peaked at about $253 per share during the Technology Bubble. By December 2002 the stock price had fallen over 96% to below $10 per share.
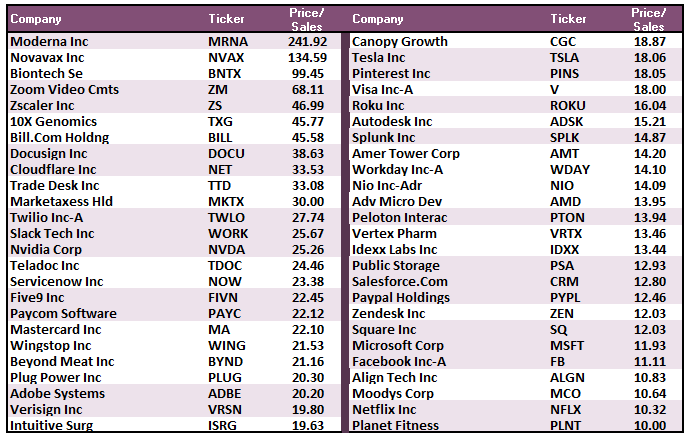
There is currently a long list of stocks trading at or above 10x sales. Look at the chart below via Lance Roberts.

Many of these companies will likely endure a similar fate as Sun Microsystems. While valuation is not a good timing indicator, it is a pretty good predictor of where the elevator stops. After a near-vertical ascent, in the middle of an election year, in the middle of a pandemic, exuberance has soared. It will be interesting over the next couple weeks to see if exuberance succumbs to the fundamental environment. If so, remember, the elevator is still near the top of the building.
The S&P 500 Index closed at 3,427 down 2.3% for the week. The yield on the 10-year Treasury Note fell to 0.72%. Oil prices decreased to $40 per barrel, and the national average price of gasoline according to AAA dropped to $2.22 per gallon.
© 2020. This material was prepared by Bob Cremerius, CPA/PFS, of Prudent Financial, and does not necessarily represent the views of other presenting parties, nor their affiliates. This information should not be construed as investment, tax or legal advice. Past performance is not indicative of future performance. An index is unmanaged and one cannot invest directly in an index. Actual results, performance or achievements may differ materially from those expressed or implied. All information is believed to be from reliable sources; however we make no representation as to its completeness or accuracy.
Securities offered through First Heartland Capital, Inc., Member FINRA & SIPC. | Advisory Services offered through First Heartland Consultants, Inc. Prudent Financial is not affiliated with First Heartland Capital, Inc.

