Executive Summary
According to an op-ed recently in Bloomberg, the labor force has contracted in 2019. Additionally, according to the article, employment according to the Bureau of Labor Statistics’ Household Survey has actually declined by 200,000 this year. This may sound unbelievable when compared to the headlines of a strong economy and a 3.7% unemployment rate. While I have previously written about the employment situation and its impact on the economy, this week in The Details I include research from others who explain unemployment details excluded from mainstream headlines. Please take a look at this week’s brief explanation of what is under the hood and based on facts.
The Details
The foundational argument that the economy is “strong” is rooted in the low U-3 unemployment rate. The current rate of 3.7% is up one-tenth of one percent over May’s rate. According to the Bureau of Labor Statistics’ Employment Situation Summary report for June 2019, there are 5.98 million people unemployed, up 87 thousand over May. For some perspective, there are presently 259 million potential workers 16 years or older, 157 million employed and 96.1 million “not in the labor force.”
Lakshman Achuthan and Anirvan Banerji co-founders of the Economic Cycle Research Institute (ECRI) recently penned an opinion article for Bloomberg titled, “The Myth of the Tight U.S. Labor Market.” In the article they pose the question, in such a “strong” economy with the unemployment rate at a half-century low and the stock market near record highs, why is the bond market signaling the Federal Reserve Bank (Fed) will soon need to ease monetary policy?
They indicate part of the answer lies in the faux growth in the jobs market stating such growth has been slowing much more than most people realize. In fact, the labor force has contracted by close to 600,000 workers this year. They go on to state, “that’s caused year-over-year payroll growth, based on the Labor Department’s Establishment Survey – a broad survey of businesses and government agencies – to decline to a 13-month low. But year-over-year job growth, as measured by the separate Household Survey – based on a Labor Department survey of actual households – that is used to calculate the unemployment rate is only a hair’s breadth from a five-and-a-half-year low. […]
Months from now, the Establishment Survey will undergo its annual retrospective benchmark revision, based almost entirely on the Quarterly Census of Employment and Wages conducted by the Labor Department…the Establishment Survey may be overstating the real numbers by more than 25%.
Since the unemployment rate is the ratio of the number unemployed to the labor force, the numerator has seen a bigger proportionate drop than the denominator. This is why the jobless rate has fallen from 3.9% to a half-century low of 3.6%. While that makes a great headline, it isn’t good news. Said another way, employment as measured by the Household Survey has actually declined this year by almost 200,000, while twice as many who were earlier unemployed have apparently given up looking for jobs.”
Looking under the hood, jobs growth has been substantially slower than the headlines might denote. The low unemployment rate masks the fact over a half a million people have exited the labor force this year.
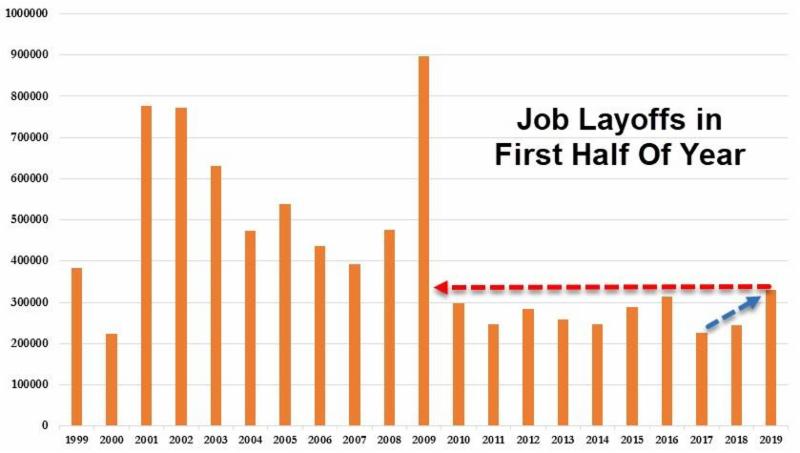
Another potential indicator of a slowing economy and evidence contradicting the “strong” jobs growth narrative is the increase in layoffs this year. Per UPFINA.com via Zero Hedge, “On the other hand, year to date cuts [job layoffs] are still up 35% from last year and this is the highest first half total since 2009.”.

I have frequently stated relying on “headlines” alone can be dangerous. More often than not, there is important information critical to formulating an opinion, or deriving a conclusion, buried in the supporting data. That is why I write these newsletters, to do some digging for our readers. The employment situation is not as clear-cut as one might think when looking strictly at the unemployment rate.
The S&P 500 Index closed at 2,990, up 1.65% for the week. The yield on the 10-year Treasury increased slightly to 2.04%. Oil prices remained at $58 per barrel, and the national average price of gasoline according to AAA rose to $2.76 per gallon.
At Prudent Financial, portfolios are developed to take into account the state of the economy, market cycle and valuation, and relative strength. Our goal is long-term growth with limited downside potential. If you need assistance with your portfolio, please give me a call. I would be happy to review your situation and explain how we can help you work towards achieving your goals.
© 2019. This material was prepared by Bob Cremerius, CPA/PFS, of Prudent Financial, and does not necessarily represent the views of other presenting parties, nor their affiliates. This information should not be construed as investment, tax or legal advice. Past performance is not indicative of future performance. An index is unmanaged and one cannot invest directly in an index. Actual results, performance or achievements may differ materially from those expressed or implied. All information is believed to be from reliable sources; however we make no representation as to its completeness or accuracy.
Securities offered through First Heartland Capital, Inc., Member FINRA & SIPC. | Advisory Services offered through First Heartland Consultants, Inc. Prudent Financial is not affiliated with First Heartland Capital, Inc.
Want to learn more about our Insurance strategies?
Set up a time to chat with us.

