



Executive Summary
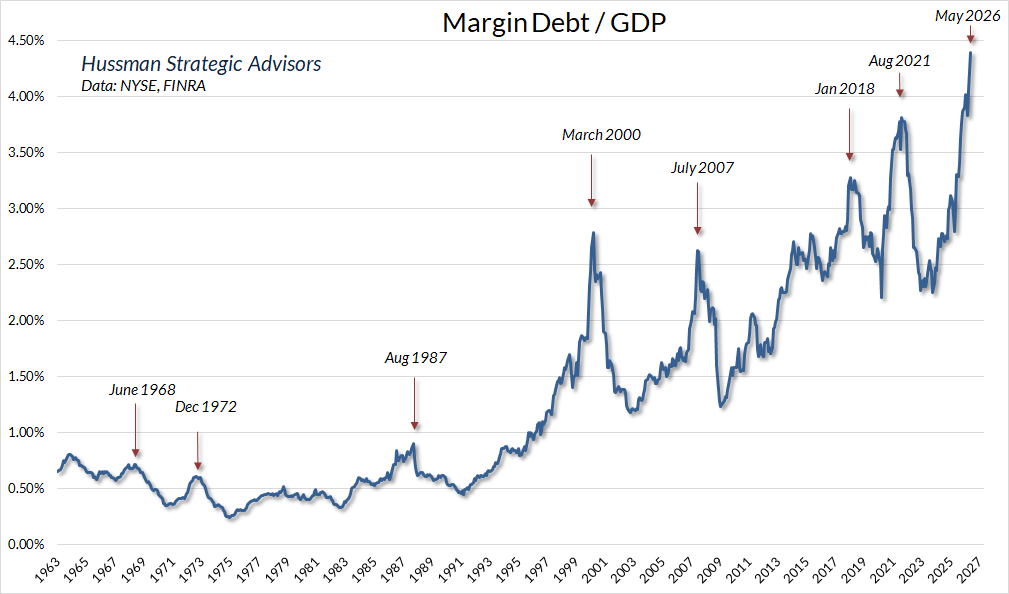
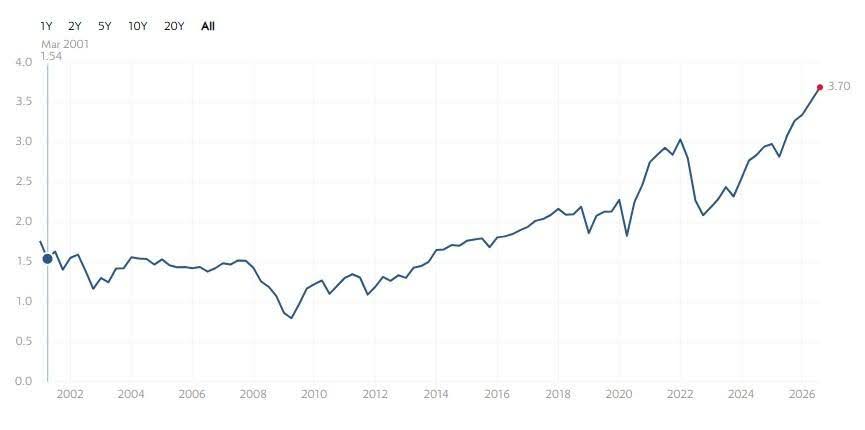
Recently I have written about the increase in speculation in the stock market as evidenced by margin debt (see first graph). Below I provide two historical valuation measures, including the Price/Sales Ratio, which is less manipulated, to show the extremes to which valuations have reached. With a long-term median of 1.63, currently the P/S of the S&P 500 is at a record high of 3.7, or 2.3 times the long-term median (see 2nd graph). Similar to the 1929 “New Era” and the 2000 “Dotcom” bubbles, current speculation is rampant for AI technology related stocks. While none of this means a crash will happen imminently, it does describe the imbedded risks to investors. Presently, the required reversion to reach median valuation levels is at unheard of levels. As in all bubbles, many will say the reversion will never happen, because this time is different. Please read to the end of this issue to see what we consider one of the best strategies for allowing both further growth and offering protection once the second half of the market cycle arrives.
For further analysis, continue to read The Details below for more information.
“Rule 2: Excesses in one direction will lead to an opposite excess in the other direction.”
–Bob Farrell
The Details
Anyone who lived through the Technology Bubble, peaking in 2000, or during the 1920’s New Era, peaking in 1929, is probably shaking their head in disbelief today, as the speculative fervor now exceeds both prior phenomena. I can say, with all certainty, that I can vividly remember only one of the two spectacles. However, I have performed much research on the earlier event.
Currently, speculative psychology is in full swing as investors lever-up with record levels of margin debt. The graph below, from July, Hussman Market Comment, illustrates the extreme level of margin debt as a percentage of GDP.
When speculative psychology takes over, all caution is thrown to the wind. Anyone who questions the validity of the bubble is considered “old fashioned” or “uninformed” about the “new” environment. Yet in the end, the final phase of the cycle, the reversion phase, always seems to rhyme. As stated by economist John Hussman in his Market Comment,
“The current level of stock market valuations remains – easily – the most speculative extreme in U.S. financial history, beyond both the 1929 and 2000 extremes. Our baseline estimate is that the S&P 500 has a material risk of losing something on the order of 75% over the completion of this cycle, a view that’s shared by GMO’s Jeremy Grantham. We can narrow that baseline estimate to a loss of about 55% if we assume that the robust profit margins of the past decade are permanent. We don’t assume that, but then, we actually don’t need to assume anything at all.”
The following, from the same Market Comment, was written at the beginning of the end of the Technology Bubble by Andrew Smithers & Steven Wright, in Valuing Wall Street, March 2000.
“Stock markets can be valued, and because they can be valued, the long-term risks involved in holding stocks vary from time to time. When stocks are cheap these risks are small, but when they are expensive the risks become very great indeed. In current conditions, the risks in holding stocks are too great to make them sensible investments. This approach is completely different than claiming that it is possible to know when the stock market has hit a peak or a trough. All that the ability to value stocks provides is the ability to assess when holding them becomes too risky. On every occasion in the past that we can find, when a stock market has become as overvalued as Wall Street was at the end of the twentieth century, the consequences have been extremely bad for the economy as well as for investors.”
Examining a couple valuation measures provides valuable evidence as to how the extremes today exceed that of even the riskiest historical bubbles. First is a look at the S&P 500 Price-to-Sales Ratio (P/S). The long-term median P/S Ratio is about 1.63. The graph below, from Multpl.com, shows the current reading is 2.3 times the historical median. At a record 3.7, it would take a correction of 56% just to touch the long-term median. This is at the low end of Hussman’s reversion range.
Price-to-Sales Ratio
The S&P 500 is now more concentrated in technology stocks than ever before. And while it is true that some of these companies have posted phenomenal earnings growth, the details of that growth might come as a surprise to some. That is a topic for another newsletter.
To provide a clear example of how ridiculous P/S Ratios have become, the recently listed company, SpaceX, is sporting a mind-numbing 115 P/S Ratio – and that is after the post-IPO downturn. Remember, the S&P 500 median P/S is 1.63! And although this company might have some unique opportunities ahead, there is no way to justify a P/S Ratio that far in the stratosphere.
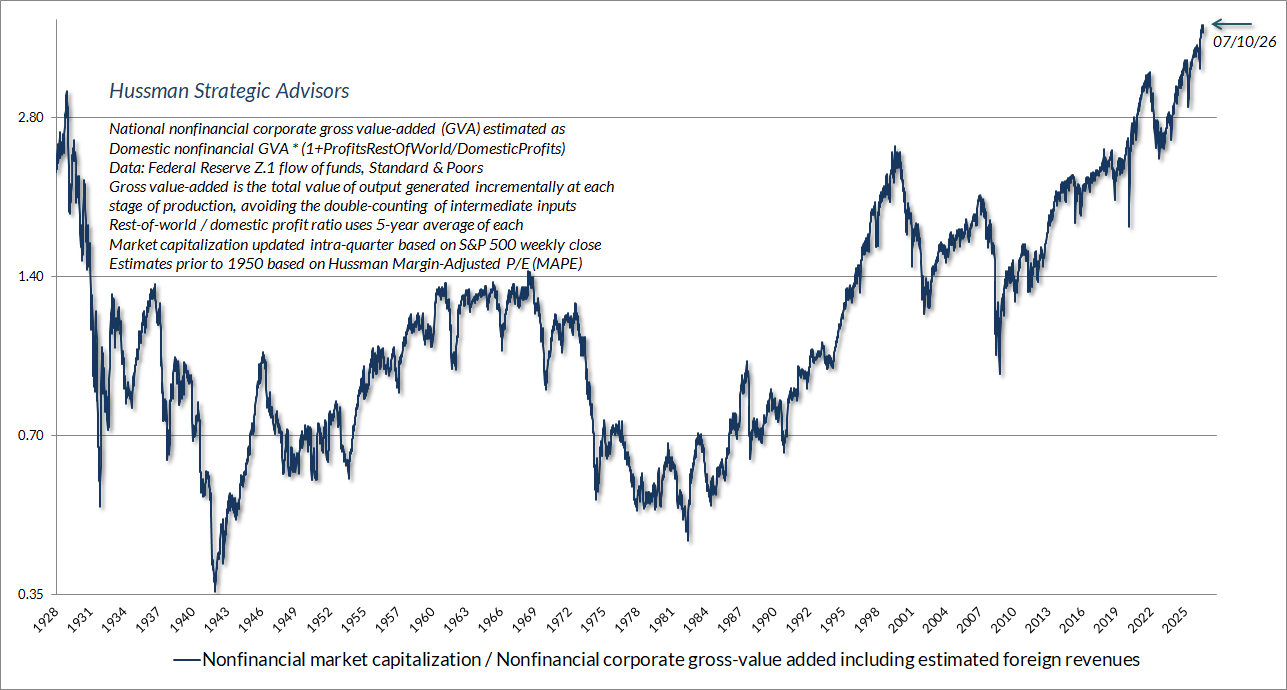
Another valuation methodology, often cited in my newsletters, is Hussman’s MarketCap/GVA, which maintains the highest correlation with subsequent actual long-term returns. As Hussman explains in his Market Comment,
“At its recent extreme, MarketCap/GVA pushed to a record high of 4.2. To put that level in perspective, the historical norm across a century of market cycles is only about 1.0. That’s also the level that has corresponded to run-of-the-mill subsequent S&P 500 annual total returns of 10% annually, in market cycles since 1928. In prior market cycles, the gap between prevailing valuations and historical norms has generally been closed, which is part of the reason why our baseline risk estimate for the S&P 500 is a loss of about 75%. The same consideration is largely what informed our March 2000 projection of an 83% loss in technology stocks, which proved both correct and improbably precise.”
Unprecedented Fed intervention, combined with enhanced gambling techniques such as zero days to expiration (0DTE) options contracts, have lengthened and boosted the current bubble. However, the outcome will likely be similar to all of its predecessors.
At this point, you might be scratching your head asking, “Then, how should I invest?” After much research, we have found what we believe to be the best option for allowing reasonable future growth while also offering significant protection against downside risk – which this newsletter has attempted to outline in an objective manner. Our approach is unique and previously was only available inside of an annuity wrapper. We can now manage portfolios using a similar strategy, without the requirement of an annuity. If you are reading this and understand the risk embedded in the market today, but like many others, have no idea how long the bubble will continue, and don’t want to sit around in cash until the reversion cycle completes, consider giving us a call to discuss how we can help navigate the next half of the cycle. It could make a substantial difference in how your portfolio fares through what could end up being one of the largest corrections in history. Now is the time for reason and understanding. If Hussman, Grantham and many others are correct, the time for action is now.
The S&P 500 Index closed at 7,490, up 1.1% for the week. The yield on the 10-year Treasury Note rose to 4.75 %. Oil prices decreased to $85 per barrel, and the national average price of gasoline according to AAA fell to $4.10 per gallon.
© 2026. This material was prepared by Bob Cremerius, CPA/PFS, of Prudent Financial, and does not necessarily represent the views of other presenting parties, nor their affiliates. This information should not be construed as investment, tax or legal advice. Past performance is not indicative of future performance. An index is unmanaged and one cannot invest directly in an index. Actual results, performance or achievements may differ materially from those expressed or implied. All information is believed to be from reliable sources; however we make no representation as to its completeness or accuracy.
Securities offered through Registered Representatives of Cambridge Investment Research, Inc., a broker/dealer, member FINRA/SIPC. Advisory services offered through Cambridge Investment Research Advisors, Inc., a Registered Investment Advisor. Prudent Financial and Cambridge are not affiliated.
The information in this email is confidential and is intended solely for the addressee. If you are not the intended addressee and have received this message in error, please reply to the sender to inform them of this fact.
We cannot accept trade orders through email. Important letters, email or fax messages should be confirmed by calling (901) 820-4406. This email service may not be monitored every day, or after normal business hours.