



Executive Summary
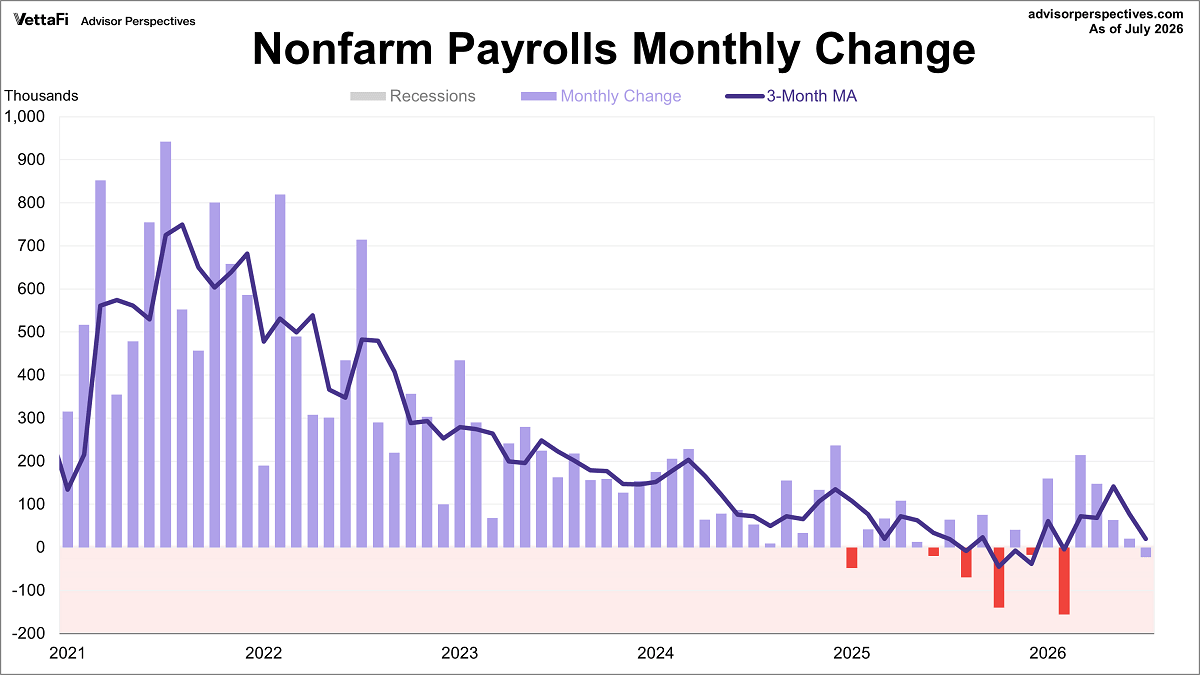
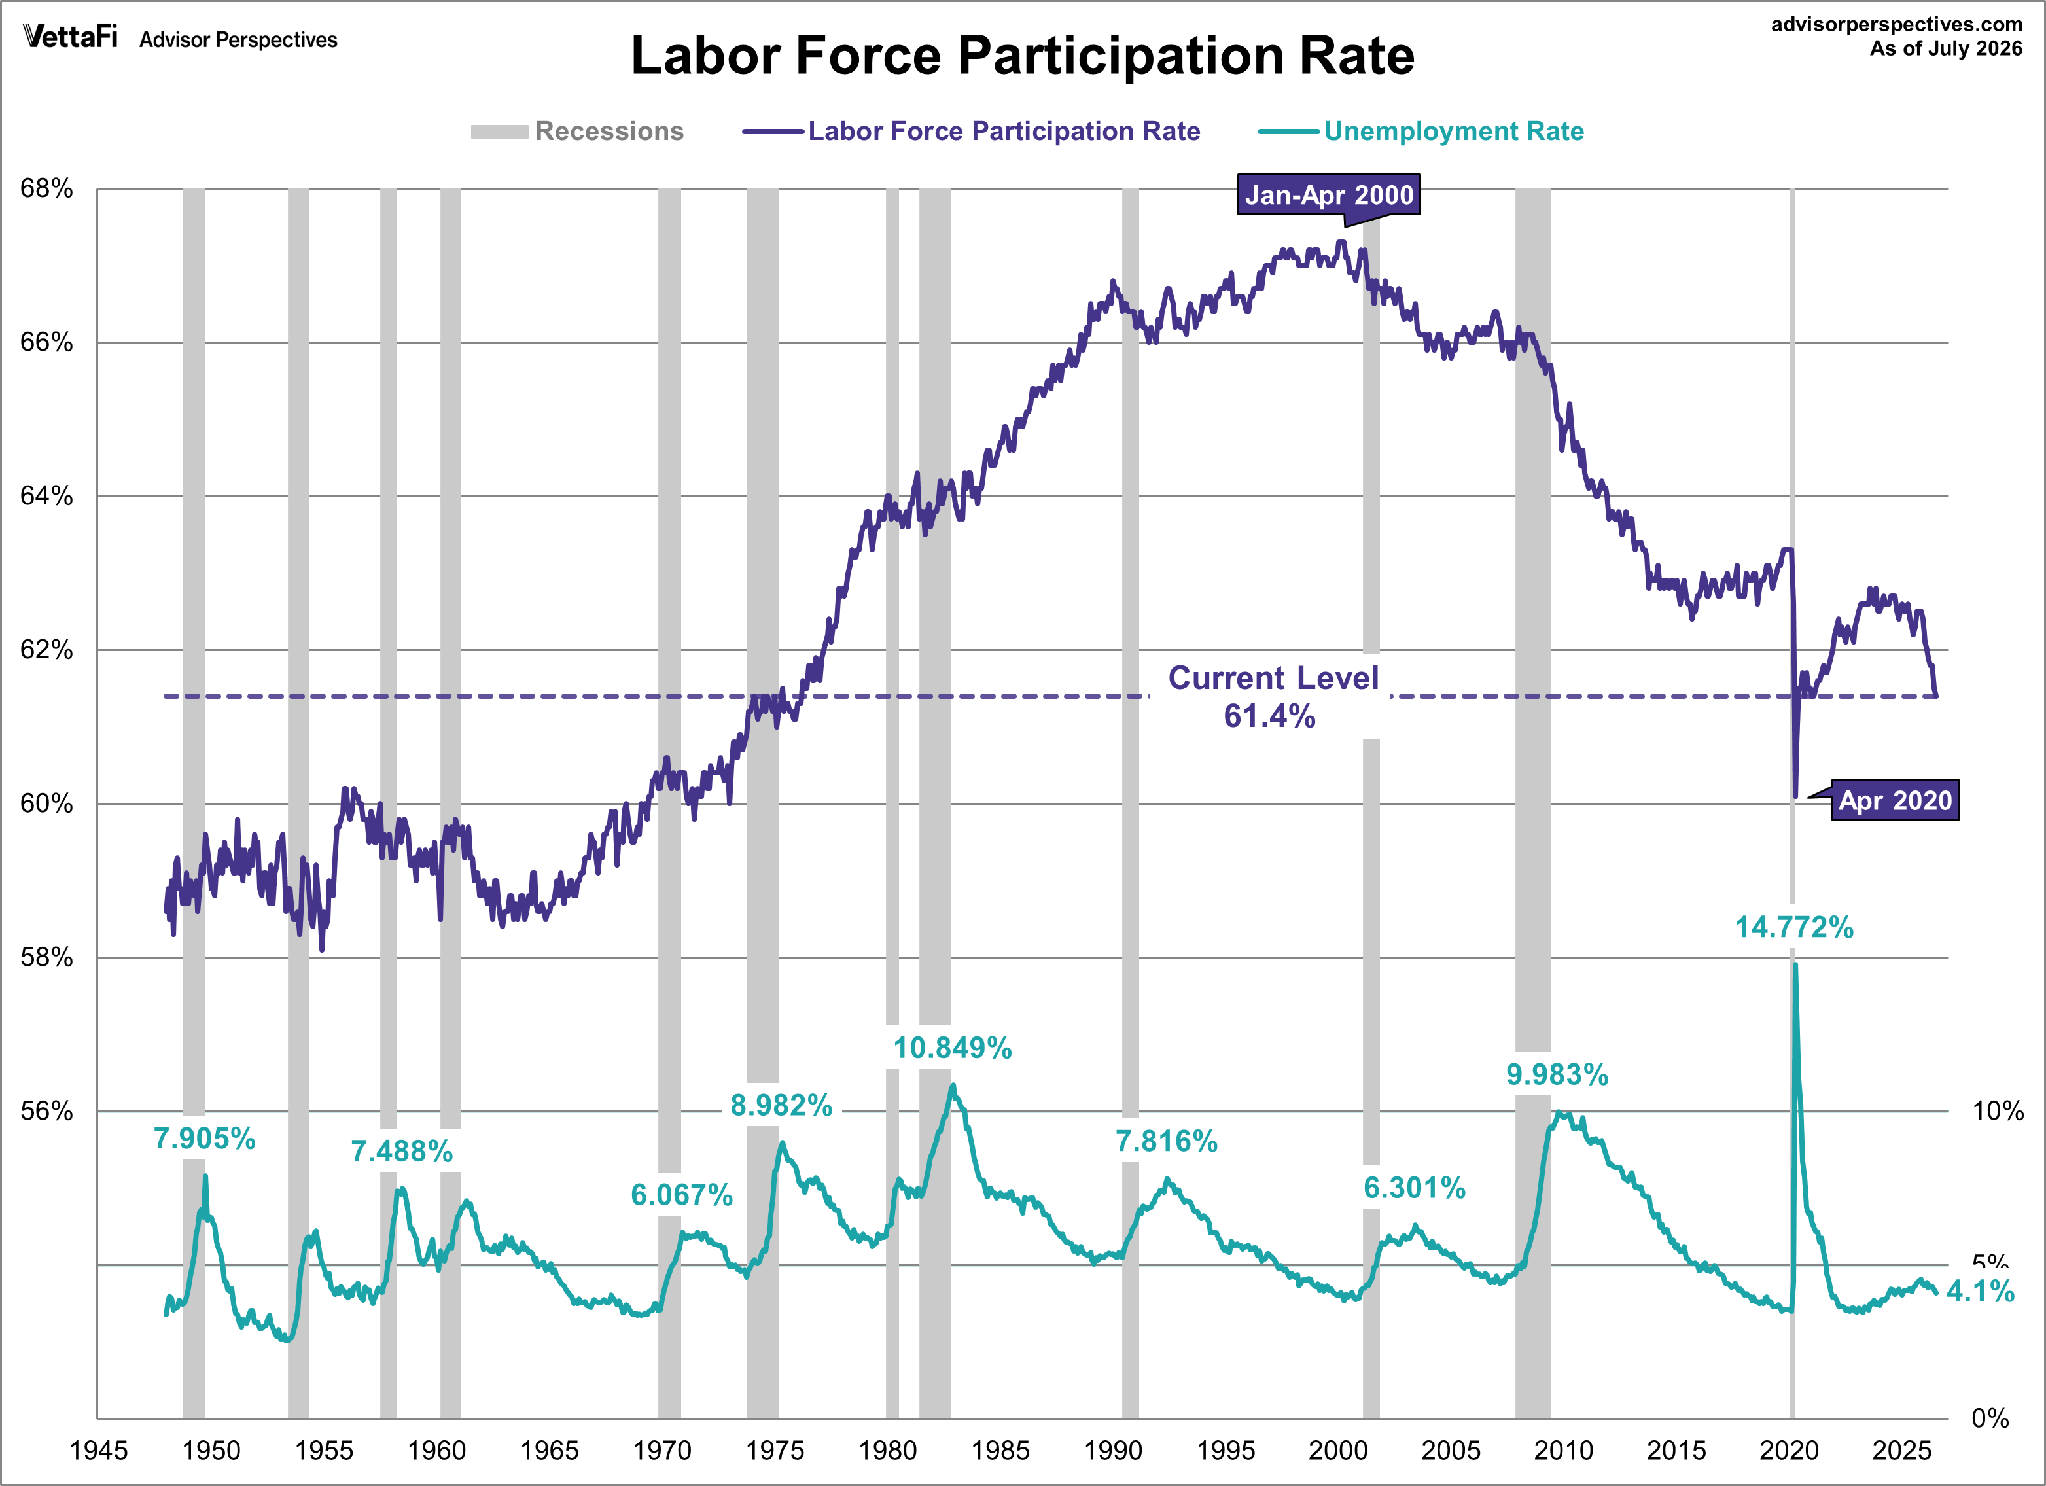
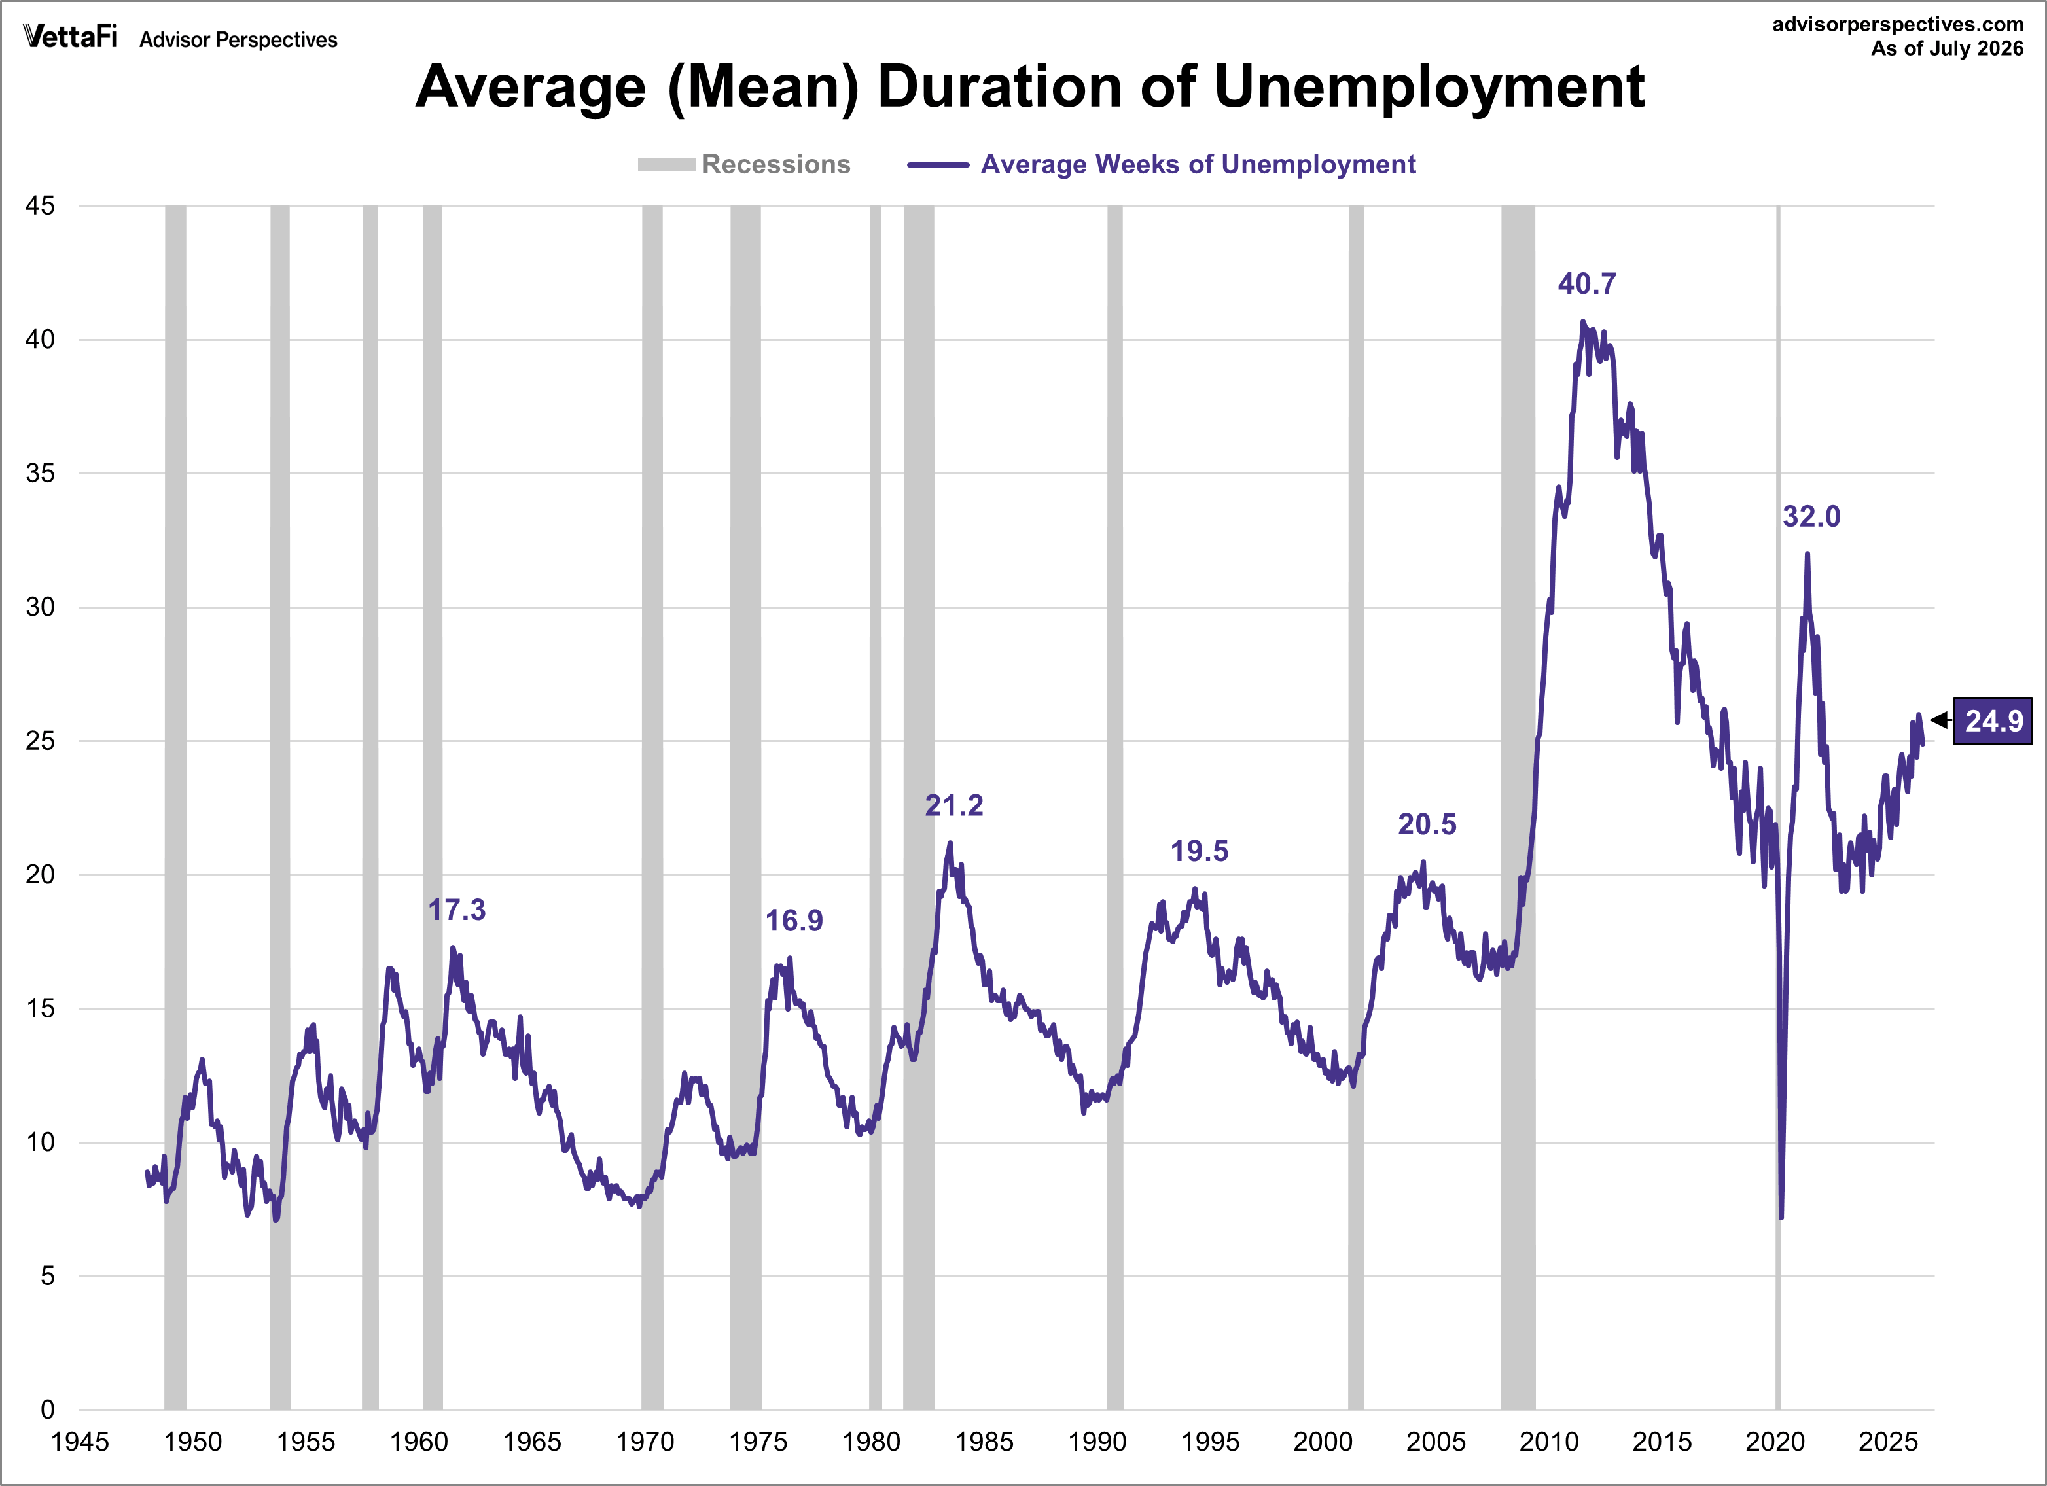
Market pundits closely watch the monthly jobs report, but recent large annual revisions—911,000 and 598,000 jobs removed over the past two years—raise questions about its reliability. Since the working-age population grows by roughly 200,000 people per month, job creation generally needs to exceed that level to signal strength. The latest report showed a loss of 23,000 jobs in July, yet unemployment rate still fell. That decline appears to reflect people leaving the labor force or stopping their job search, rather than a stronger labor market. The accompanying graphs highlight decreases in Nonfarm Payrolls and Labor Force Participation. With the average duration of unemployment also rising, the jobs market may be signaling broader economic weakness.
For further analysis, continue to read The Details below for more information.
“Depressions and mass unemployment are not caused by the free market but by government interference in the economy.”
–Ludwig von Mises
The Details
July’s payroll report confirms the downturn in the labor market, of which I wrote about on September 16, 2025, and again July 8, 2026. The first week of each month, market pundits await the announcement of the number of jobs created in the prior month. One would think it was the most important number in the world, when in reality the number has proven to be one of the most unreliable data points proclaimed.
Historically, the working-age population has grown by about 200,000 people per month. Therefore, one would expect average job gains to exceed this number. The initial release from the Bureau of Labor Statistics (BLS) of prior month’s new jobs has become so inaccurate that one has to wonder why it is even given any credence by market participants. For instance, the annual revision for the period April 2024 through March 2025 eliminated 911,000 previously announced jobs. The same period the year before wiped away about 598,000 jobs. And these changes were subsequent to the normal monthly revisions. The final revised data showed that in 2025 there were only about 15,000 jobs created, a far cry from the growth in the working-age population.
The most recent report stunned pundits by revealing a 23,000 loss in jobs. And that is before any subsequent adjustments. More importantly, the previously celebrated jobs numbers for May and June, despite their lackluster results, were revised significantly downward. For May the new jobs created were marked down from 129,000 to only 63,000. And June was revised from 57,000 to a mere 20,000. The numbers for the past three months of 63,000, 20,000 and a loss of 23,000 highlight a disturbing downward trend. See the weakening jobs market in the graph below from VettaFi.
Some readers might be confused as to why the unemployment rate has not risen with the weak change in new jobs. The reality is that many who were unemployed have become discouraged and have stopped looking for new jobs. When this happens, they fall out of the labor force. The graph below illustrates the decline in the labor force participation rate from about 2000 until now. The trend has once again turned downward after the post-Covid surge in job gains.
Another measure of the strength (or weakness) of the jobs market is the length of time one remains unemployed, before either getting a job or giving up and dropping out of the labor force. The following graph shows the average duration of unemployment in weeks. Currently, at 24.9 weeks, it is the highest on record, outside of the post-Great Recession/Financial Crisis and post-Covid periods, dating back to 1950.
Including last month’s reported drop in jobs, the year-to-date revised new jobs number is about 59,300 per month. This continues to fall short of the growth in the working-age population. When job growth turns into job losses, it could be signaling a potential recession. Next month it will be interesting to see if July’s number is revised upwards or as an even larger loss. If losses continue into August, that would be a warning sign that growth is stalling. If inflation continues, it could be a signal that stagflation has arrived. Will the downward trend in jobs continue? We will have to wait and see.
The S&P 500 Index closed at 7,758, up 3.6% for the week. The yield on the 10-year Treasury Note fell to 4.66 %. Oil prices decreased to $78 per barrel, and the national average price of gasoline according to AAA fell to $4.01 per gallon.
© 2026. This material was prepared by Bob Cremerius, CPA/PFS, of Prudent Financial, and does not necessarily represent the views of other presenting parties, nor their affiliates. This information should not be construed as investment, tax or legal advice. Past performance is not indicative of future performance. An index is unmanaged and one cannot invest directly in an index. Actual results, performance or achievements may differ materially from those expressed or implied. All information is believed to be from reliable sources; however we make no representation as to its completeness or accuracy.
Securities offered through Registered Representatives of Cambridge Investment Research, Inc., a broker/dealer, member FINRA/SIPC. Advisory services offered through Cambridge Investment Research Advisors, Inc., a Registered Investment Advisor. Prudent Financial and Cambridge are not affiliated.
The information in this email is confidential and is intended solely for the addressee. If you are not the intended addressee and have received this message in error, please reply to the sender to inform them of this fact.
We cannot accept trade orders through email. Important letters, email or fax messages should be confirmed by calling (901) 820-4406. This email service may not be monitored every day, or after normal business hours.