Executive Summary
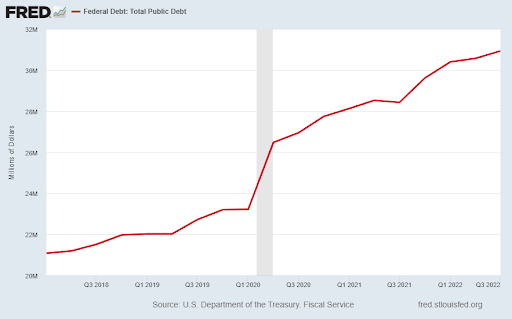
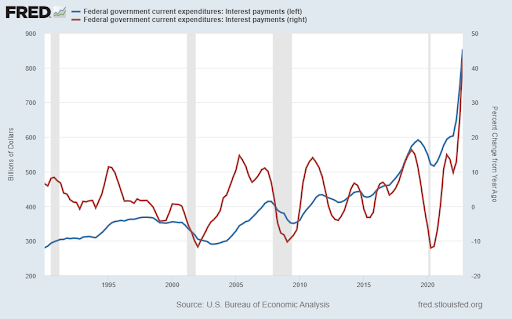
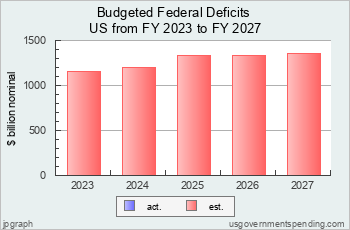
The first graph below illustrates the massive increase in the national debt, which now totals over $31.5 trillion. With interest rates rising, the cost of carrying the U.S. debt skyrocketed 40% (see second graph). By ignoring the future costs of uncontrollable Federal debt, policymakers are contributing to a compounding problem. Projections of Federal deficits add over one trillion a year each year for the foreseeable future. Increasing federal debt combined with higher interest costs are the compounding problem. Should policymakers take their blindfolds off?
Please continue to The Details for more of my analysis.
“If liberty means anything at all, it means the right to tell people what they do not want to hear.”
–George Orwell
The Details
The surge in inflation from around 2% pre-pandemic to a peak of 9% in June 2022 led to a significant increase in interest rates. The rise in rates has unearthed a crisis in the making surrounding the sustainability of U.S. debt. When the 10-year Treasury was yielding next to nothing, nobody worried about the debt balance. It was almost as if they assumed rates would never rise again. The dramatic rise in spending to “save” the economy, shut down by Covid19, added trillions to the Federal debt. It was not until inflation jumped, forcing the Fed to drastically raise interest rates, that some began to refocus on the impact such a rise would have on debt carrying costs. In this newsletter, I will provide a brief overview of the crisis brewing.
The graph below illustrates the massive increase in the national debt, now totaling over $31.5 trillion. This balance is 3.4 times the balance in December 2007, before the Great Recession. And it is 37% higher than the pre-pandemic balance.

The cost of carrying this debt (interest) has skyrocketed 40% over the past year as shown in the graph below.

With deficits projected to exceed $1 trillion each year as far as the eye can see, the problem will only compound. As interest rates remain high, new Treasury securities are issued with higher current rates. And as securities mature, in an environment of infinite deficits, the securities will have to be rolled into new issues. These will again contain the higher rates. Currently, the average interest rate on outstanding Treasuries is around 2.5%. In 2021 the average was about 1.61% rising to a little over 2% in 2022. Do you see the trend?
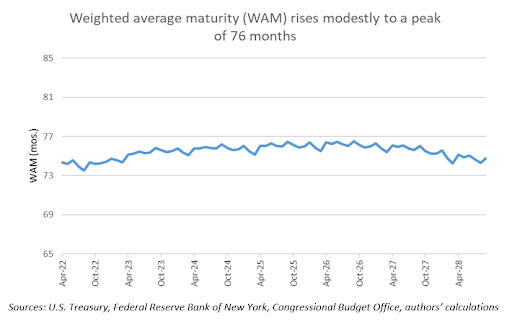
So, how fast will existing Treasuries have to be rolled over? The weighted average maturity of outstanding Treasury securities is about 75 months or 6.25 years, as shown below, according to the Brookings Institution.

That means if interest rates remain high over the next five or six years, the interest cost on outstanding debt will soar. Total Federal spending for 2023 is expected to be about $5.8 trillion. Of this, Social Security and Medicare benefits will cost the government close to $2 trillion (gross). Spending net of Social Security and Medicare could be around $3.8 trillion. Projected revenues for 2023 are about $4.6 trillion. Of this income taxes represent about $3 trillion. As you can see, rising interest costs – both due to high rates and rising deficits – will put an increasing strain on Federal spending.

By ignoring the future costs of uncontrollable Federal debt, policymakers are contributing to a compounding problem. The average interest rate on outstanding Treasury securities could soon be double that of 2021. This combined with a debt balance growing over $1 trillion per year means interest costs will continue to spiral. If a recession becomes apparent this year, the typical Federal response is to increase spending. If this occurs, then expect even higher interest rates and deficits. Policymakers had better take their blindfolds off soon!
The S&P 500 Index closed at 4,136, up 1.6% for the week. The yield on the 10-year Treasury Note rose to 3.53%. Oil prices decreased to $73 per barrel, and the national average price of gasoline according to AAA fell to $3.48 per gallon.
© 2021. This material was prepared by Bob Cremerius, CPA/PFS, of Prudent Financial, and does not necessarily represent the views of other presenting parties, nor their affiliates. This information should not be construed as investment, tax or legal advice. Past performance is not indicative of future performance. An index is unmanaged and one cannot invest directly in an index. Actual results, performance or achievements may differ materially from those expressed or implied. All information is believed to be from reliable sources; however we make no representation as to its completeness or accuracy.
Securities offered through First Heartland Capital, Inc., Member FINRA & SIPC. | Advisory Services offered through First Heartland Consultants, Inc. Prudent Financial is not affiliated with First Heartland Capital, Inc.

