Executive Summary
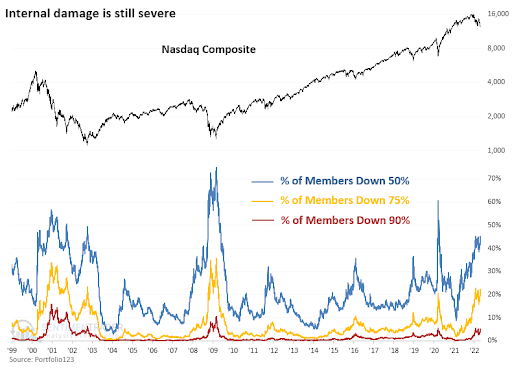
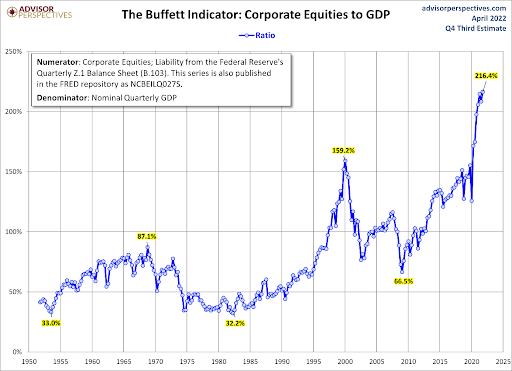
Economist John Hussman recently stated speculative bubbles teach investors “dangerously incorrect lessons” that “stocks always recover.” Stock market indices have turned negative this year, and the dispersion of returns within are disturbing (second graph). The Buffet Indicator (third graph) shows much more room to fall to get back to normal valuations. And the Federal Reserve Bank appears to have resolved itself to fighting inflation in attempt at “saving the economy,” even if the stock market is sacrificed. The current landscape of high inflation, slowing economy, falling corporate earnings, and rising interest rates are headwinds and indicate it is time to take precautions.
Please proceed to The Details.
“Prevention is better than cure.”
–Desiderius Erasmus
The Details
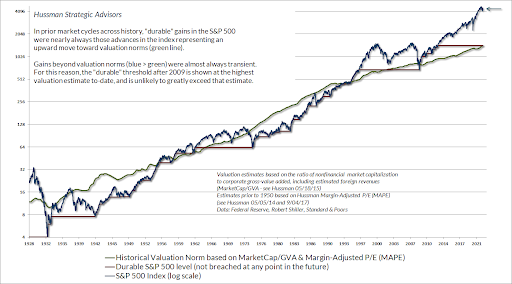
Over a decade of excessively loose monetary policy combined with extreme Federal stimulus programs created the most overvalued stock market bubble in history. As economist John Hussman stated in his Market Comment,
“The greatest danger of speculative bubbles is that by their peak, they’ve taught investors all the wrong lessons. See, the only way valuations can reach extremes like 1929, and 2000, and today is by advancing above every lesser valuation, without consequence. In the process, investors ‘learn’ that valuations are irrelevant; that stocks always recover; that the Fed or some other feature of the ‘new economy’ can be relied on to drive prices ever higher. All of these ‘lessons’ are dangerously incorrect. Unfortunately, they are only unlearned when the bubble collapses. Measured from the bubble peak, investors also typically experience a very long, interesting trip to nowhere for a decade or more. The correct lesson is this: market advances that steeply overshoot historical valuation norms generally prove to be transient over the complete market cycle.”

I stated a few weeks back that the stock market had turned the corner and entered a bear market. Many people define a bear market as a drop of at least 20% in a particular stock index. Currently, the S&P 500 is down around 16% year-to-date. However, the Nasdaq is down about 25% year-to-date and about 27% from its recent high. The Russell 2000 small cap index is down 21% year-to-date and 28% from its high last year. More importantly, the overall trend for the stock market has turned downward.
And the dispersion of returns inside of the indices is more disturbing. Look at the graph below (via Jason Goepfert/Twitter) illustrating that more than 45% of stocks in the Nasdaq are down 50%; more than 22% of stocks are down 75%; and more than 5% of stocks are down 90%!

And yet even with so many stocks down, the Buffett Indicator shows a stock market still more overvalued than ever before in history.

Therefore, even though many of the previous high-flyers have fallen significantly, the overvalued market has much further to go to return to mean valuations. The risk to stock prices is high due to a slowing economy, rising interest rates, falling corporate earnings and presently high inflation. The Fed appears determined to try and rein-in inflation. It seems they have reconciled to sacrifice the stock market in an attempt to save the economy. However, the Fed is limited in what it can do to offset supply shocks. Instead, what is likely to happen is their monetary policy will push the economy into recession.
If global demand falls enough, then prices could moderate. Also, the dollar has been on a terror versus other currencies. The strong dollar means the U.S. is importing deflation. As explained in last week’s missive, consumer savings has already been hit as stimulus funds have dried up. And to make matters worse, consumer credit is soaring. Here is how economist David Rosenberg explained it in his recent Early Morning with Dave report, “Consumers have gone into debt incrementally by $107 billion in just the past three months, which has only happened two other times in the past. Here is the problem with that ‘excess saving’ theme — it is not exactly evenly distributed. And the extent of this surge in borrowings is an act of desperation as people are being forced to use credit to buy things like gas and food — this is not about buying autos and appliances. We saw such huge debt explosions in November 2001, September 1981, and January 1971. This is a classic countercyclical development, both unwelcome and troublesome.”
Red flags continue to wave for the stock market as the economy nears a recession, and the Fed continues to tighten monetary policy. Higher interest rates will soon put the brakes on the real estate market. Many are unaware of the new units coming to completion in the multi-family market. Here is how David Rosenberg explained it, “And the big kicker will be coming from residential rents as the apartment market gets hit with a deluge of supply in the second half of the year, as the 48-year high number of units under construction morph into completions.”
It is time to take precautions.
The S&P 500 Index closed at 4,132, down 0.2% for the week. The yield on the 10-year Treasury
Note jumped to 3.12%. Oil prices increased to $110 per barrel, and the national average price of gasoline according to AAA rose to $4.32 per gallon.
© 2022. This material was prepared by Bob Cremerius, CPA/PFS, of Prudent Financial, and does not necessarily represent the views of other presenting parties, nor their affiliates. This information should not be construed as investment, tax or legal advice. Past performance is not indicative of future performance. An index is unmanaged and one cannot invest directly in an index. Actual results, performance or achievements may differ materially from those expressed or implied. All information is believed to be from reliable sources; however we make no representation as to its completeness or accuracy.
Securities offered through First Heartland Capital, Inc., Member FINRA & SIPC. | Advisory Services offered through First Heartland Consultants, Inc. Prudent Financial is not affiliated with First Heartland Capital, Inc.

