



Executive Summary
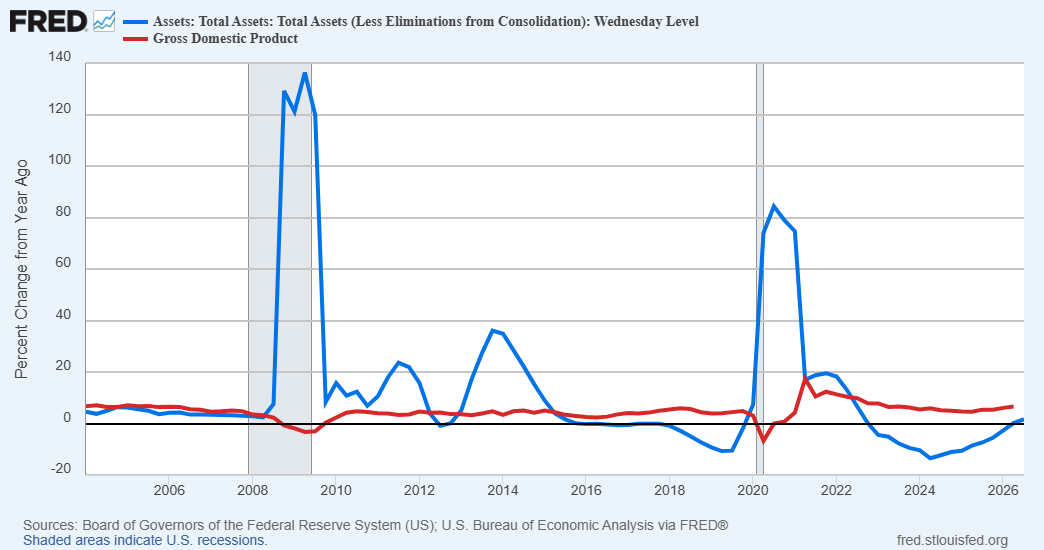
Every time a crisis occurred in recent history, global central banks have created more money to “paper over” any disruptions to global economies (see first graph). Interestingly, one can see the rate of change in liquidity far exceeds the rate of change in growth of GDP. Specifically in the U.S. (see 2nd graph), the growth in liquidity dwarfs any return to normalcy post crisis or recession. So, the question to ponder from this week’s condensed issue is, how much longer can debt and the growth in the money supply exceed real GDP growth before inflation becomes a serious problem?
For further analysis, continue to read The Details below for more information.
“Rapid increases in the quantity of money produce inflation. Sharp decreases produce depression.”
–Milton Friedman
The Details
For this abbreviated work week, I will provide a condensed newsletter. Just some tidbits providing a little food for thought. As written about many times in the past, every time a financial crisis or disruption in the economy occurs, central banks globally have come to the rescue by creating more money. The rate of change in the liquidity far exceeds the rate of change in the growth of GDP. And there has been no major reversion to the mean. The graph and statement below are from an X post by David Stockman, author and former budget director under President Reagan.
“Behold, the great central bank money flood: Combined balance sheets up by 25X since 1987 versus just 7X for global GDP. Deficit-running government[s] around the world loved [their] bond-buying money printers until…Kevin Warsh came along and vowed to keep the lead dog’s printing presses on idle.”
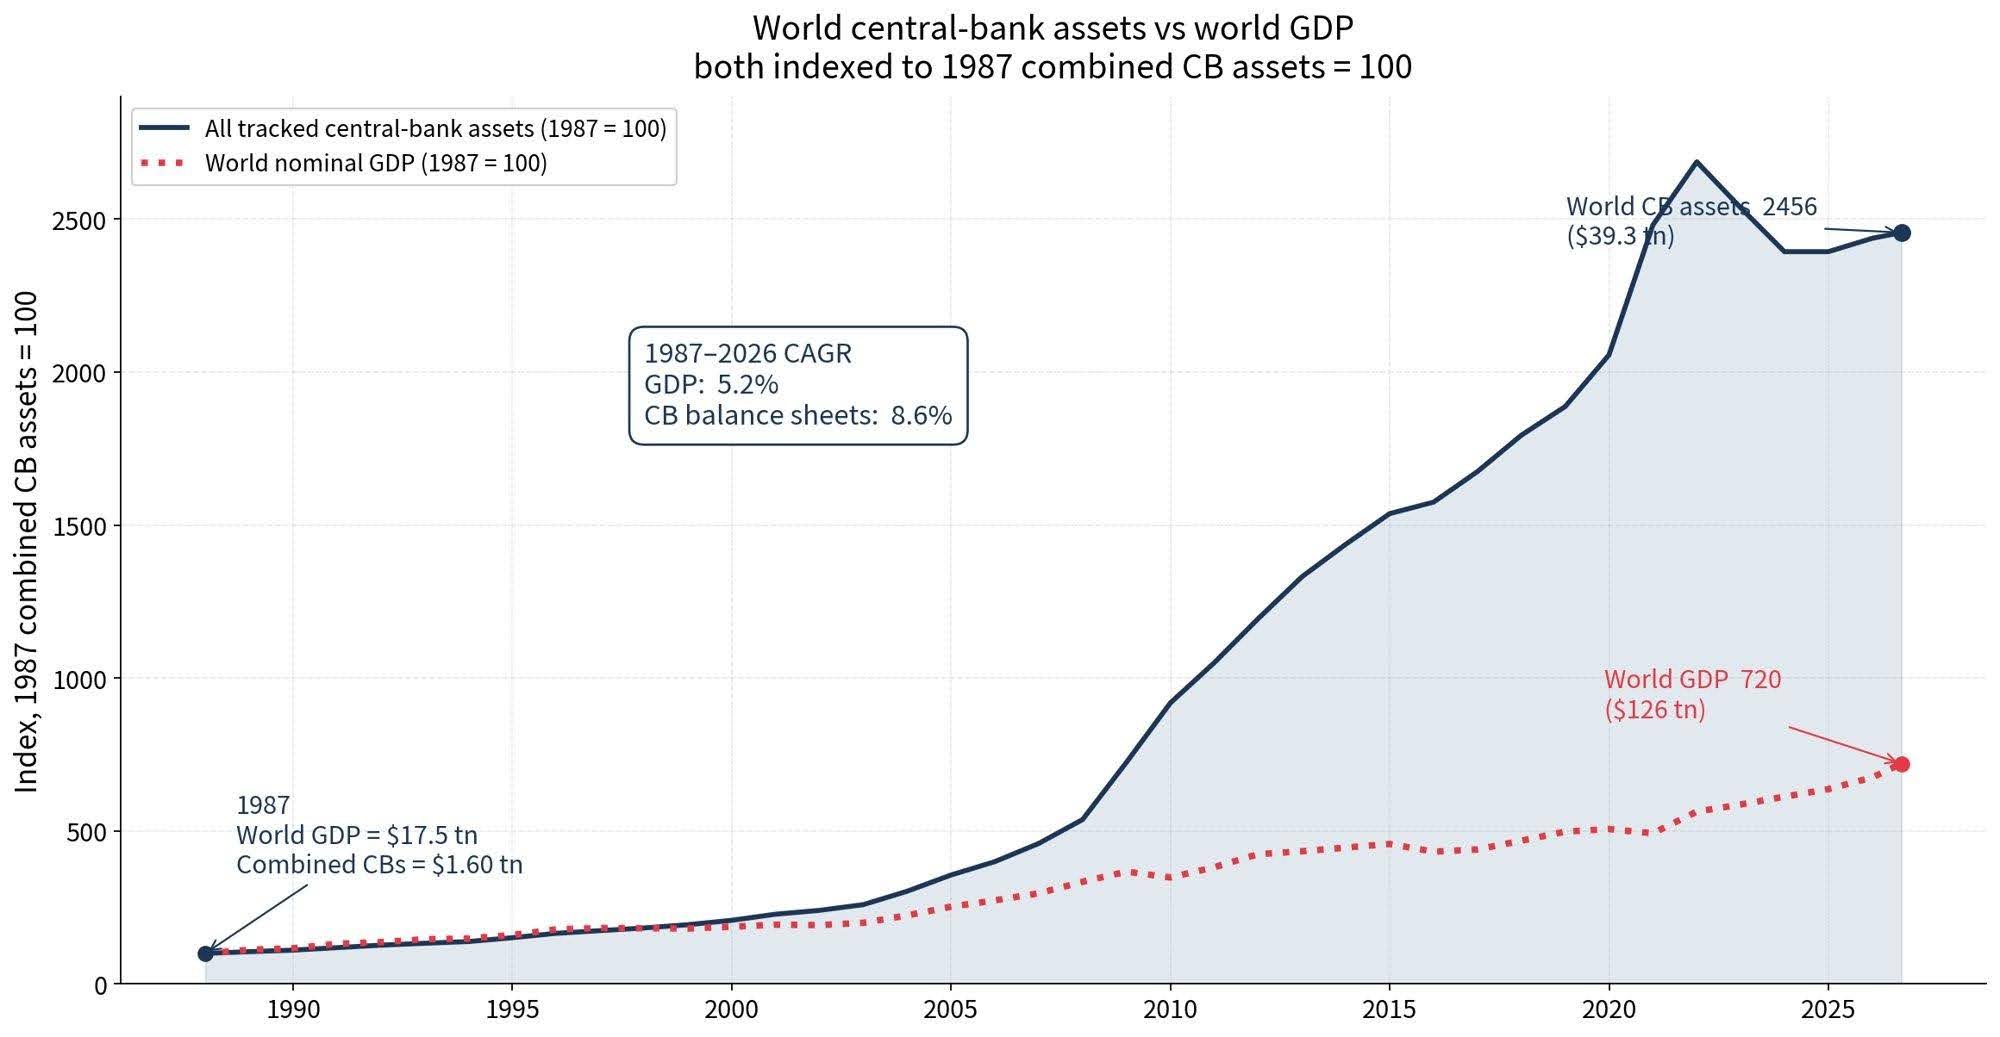
What will happen if central banks stop flooding the global economy with money? How long can central banks keep the global economy growing, and at what cost? Isolating the United States, the following graph shows the nominal (before inflation) growth in U.S. economic growth in red. Notice that during the past two recessions, when growth in the red line dipped below zero, the Fed massively increased their balance sheet (blue line). The small decreases in the balance sheet, when the blue line dropped below zero, have been minimal compared to the increases. And their reductions didn’t last long.
The following graph illustrates the growth in dollars of the U.S. money supply (M2) in blue (left side). The rate of change in M2 is shown in red (right side). After exploding during the pandemic, M2 briefly began to fall, but soon thereafter started rising again.
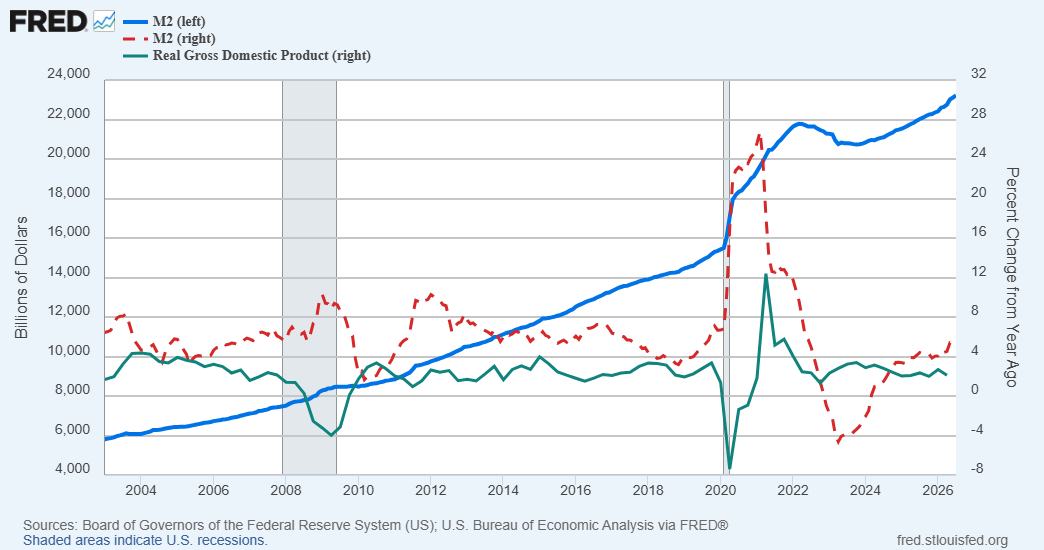
The question we will eventually find out the answer to is, how much longer can debt and the growth in the money supply exceed real GDP growth (green line above) before inflation becomes a serious problem?
The S&P 500 Index closed at 7,719, up 0.1% for the week. The yield on the 10-year Treasury Note rose to 4.78 %. Oil prices increased to $91 per barrel, and the national average price of gasoline according to AAA rose to $4.15 per gallon.
© 2026. This material was prepared by Bob Cremerius, CPA/PFS, of Prudent Financial, and does not necessarily represent the views of other presenting parties, nor their affiliates. This information should not be construed as investment, tax or legal advice. Past performance is not indicative of future performance. An index is unmanaged and one cannot invest directly in an index. Actual results, performance or achievements may differ materially from those expressed or implied. All information is believed to be from reliable sources; however we make no representation as to its completeness or accuracy.
Securities offered through Registered Representatives of Cambridge Investment Research, Inc., a broker/dealer, member FINRA/SIPC. Advisory services offered through Cambridge Investment Research Advisors, Inc., a Registered Investment Advisor. Prudent Financial and Cambridge are not affiliated.
The information in this email is confidential and is intended solely for the addressee. If you are not the intended addressee and have received this message in error, please reply to the sender to inform them of this fact.
We cannot accept trade orders through email. Important letters, email or fax messages should be confirmed by calling (901) 820-4406. This email service may not be monitored every day, or after normal business hours.