Executive Summary
In this missive, I will review debt levels and growth of the following types of debt: Federal, nonfinancial corporate, and household and nonprofit organizations. I will examine the rate of growth of each of these categories of debt from 1980 to present. This rate of growth will then be compared to the rate of growth of real GDP (spoiler alert: over 3 times). The drag on growth is glaring (See first two graphs below). With the Federal deficit for fiscal 2021 already over $2 trillion while Congress mulls additional massive stimulus and/or infrastructure plans, and 2022 is expected to be at least $1 trillion and possibly higher by multiples depending on Congress’ actions, the debt obstacle is only becoming larger.
Please proceed to The Details for a more in-depth analysis.
“It’s amazing how fast later comes when you buy now!”
–Milton Berle
The Details
There are two basic categories of debt: productive and nonproductive, sometimes referred to as good debt and bad debt. Productive debt represents borrowing to invest in a venture which produces goods or services. The venture has the potential to generate income which can be used to service the debt. Nonproductive or bad debt, on the other hand, is debt obtained for consumption. No income will be generated to service the debt. Therefore, nonproductive debt effectively pulls forward future consumption to today. Nonproductive debt can produce a drag on future economic growth since future funds will be needed to service the debt. Unfortunately, most of the debt incurred over the past decades by the Federal government, corporations, and households has been nonproductive debt. Despite optimistic calls for soaring GDP growth as the economy bounces back from the throes of the pandemic, the bounce will likely be temporary as the structural underpinnings of nonproductive debt produce an impediment on future economic growth.
In this missive, I will review debt levels and growth of the following types of debt: Federal, nonfinancial corporate, and household and nonprofit organizations. I will examine the rate of growth of each of these categories of debt from 1980 to present. This rate of growth will then be compared to the rate of growth of real GDP. The drag on growth is glaring. With the Federal deficit for fiscal 2021 already over $2 trillion while Congress mulls additional massive stimulus and/or infrastructure plans, and 2022 is expected to be at least $1 trillion and possibly higher by multiples depending on Congress’ actions, the debt obstacle is only becoming larger.
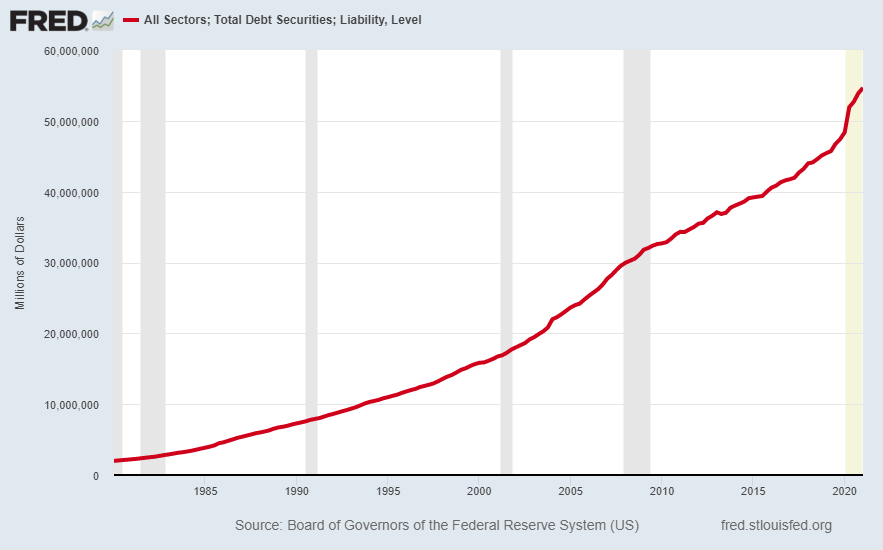
The following graphs were prepared using the St. Louis Fed’s FRED database. The first graph shows total debt for all sectors equals $54.7 trillion. The average annual rate of growth since 1980 is 8.3%.

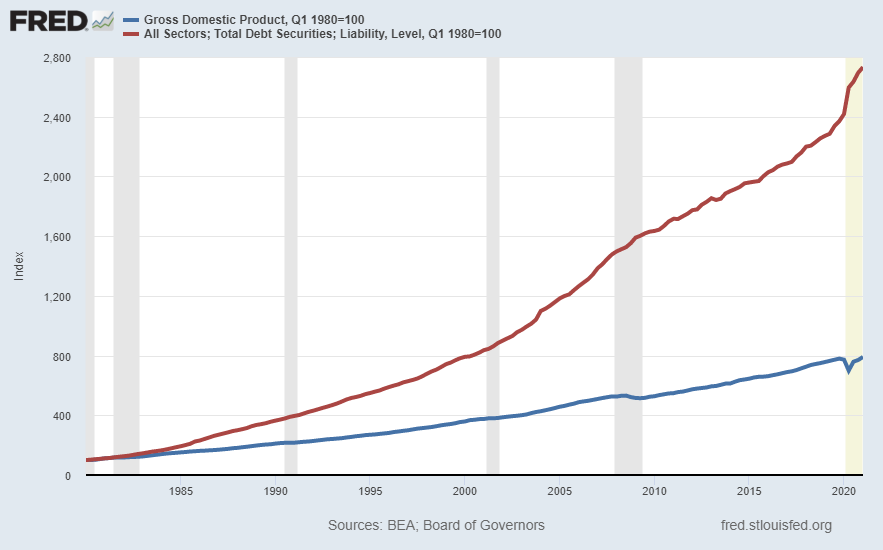
To see whether the incredible increase in total debt has resulted in accelerating GDP growth, as would be expected if this were productive debt versus declining growth rates for nonproductive debt, the following graph compares the growth of total debt and nominal GDP. The growth rate of nominal GDP has averaged 5.1% annually compared to the growth in total debt of 8.3% as mentioned above. Real (inflation adjusted) GDP has averaged a mere 2.5% annual growth. Total all-sector debt has grown at a rate of over three times real GDP.

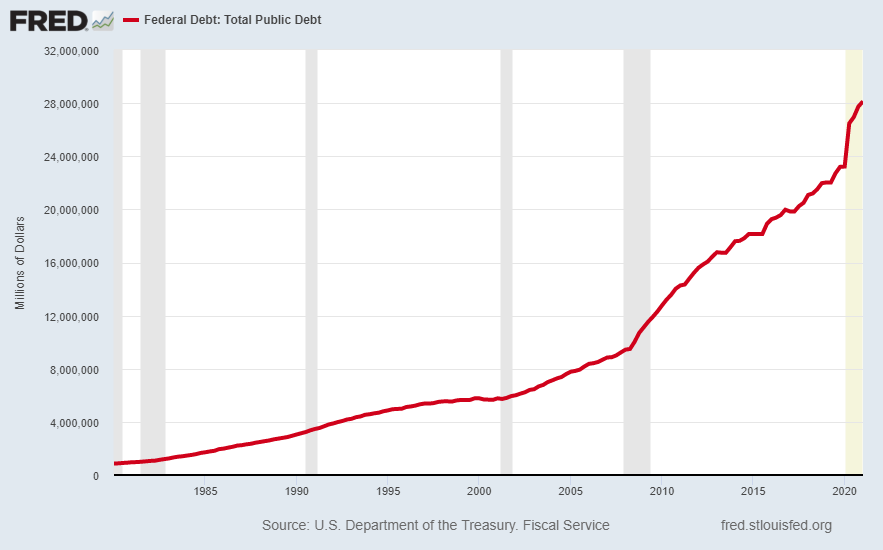
Looking strictly at Federal government debt, the following chart shows the Federal debt growing from 1980 to present at an average annual rate of 8.7%. At $28.1 trillion, the current balance equals over 130% of GDP.

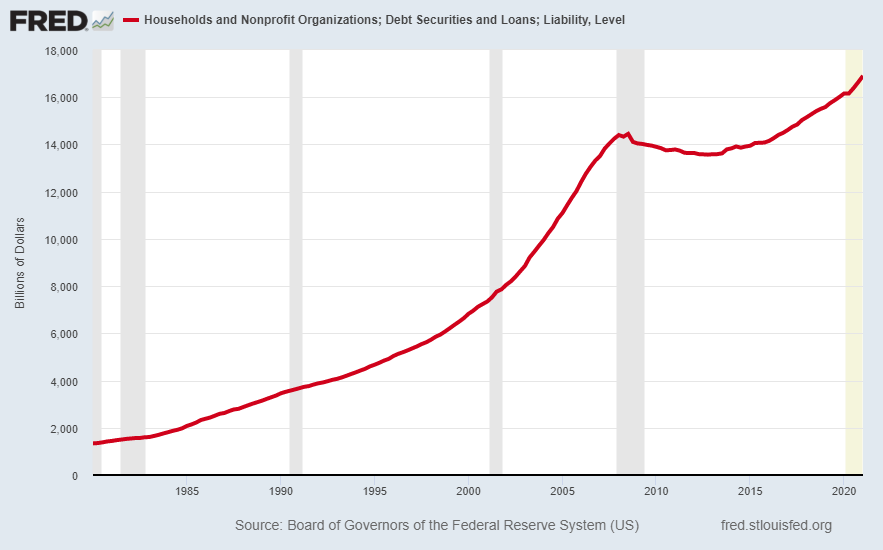
Household and nonprofit organizations have accumulated over $15.5 trillion in debt since 1980. This represents an average annual growth rate of 6.4%. Notice after the Financial Crisis ended in 2009, household debt fell mostly attributable to defaults and foreclosures; however, households used this period to clean up their balance sheets. But with the Federal Reserve Bank’s encouragement – through low interest rates – household debt is once again taking-off.

To recap, debt has been growing at over three times that of real GDP. The tremendous levels of debt have been bolstered by Monetary Policy. This short-sighted policy has led to unprecedented levels of future consumption brought forward leaving heavy burdens on future income. These burdens combined with an aging baby boomer population portends for lower economic growth. The more nonproductive debt incurred today, the more future growth will suffer.
The S&P 500 Index closed at 4,247 up 0.41% for the week. The yield on the 10-year Treasury Note fell to 1.46%. Oil prices increased to $71 per barrel, and the national average price of gasoline according to AAA rose to $3.08 per gallon.
© 2021. This material was prepared by Bob Cremerius, CPA/PFS, of Prudent Financial, and does not necessarily represent the views of other presenting parties, nor their affiliates. This information should not be construed as investment, tax or legal advice. Past performance is not indicative of future performance. An index is unmanaged and one cannot invest directly in an index. Actual results, performance or achievements may differ materially from those expressed or implied. All information is believed to be from reliable sources; however we make no representation as to its completeness or accuracy.
Securities offered through First Heartland Capital, Inc., Member FINRA & SIPC. | Advisory Services offered through First Heartland Consultants, Inc. Prudent Financial is not affiliated with First Heartland Capital, Inc.

