Executive Summary
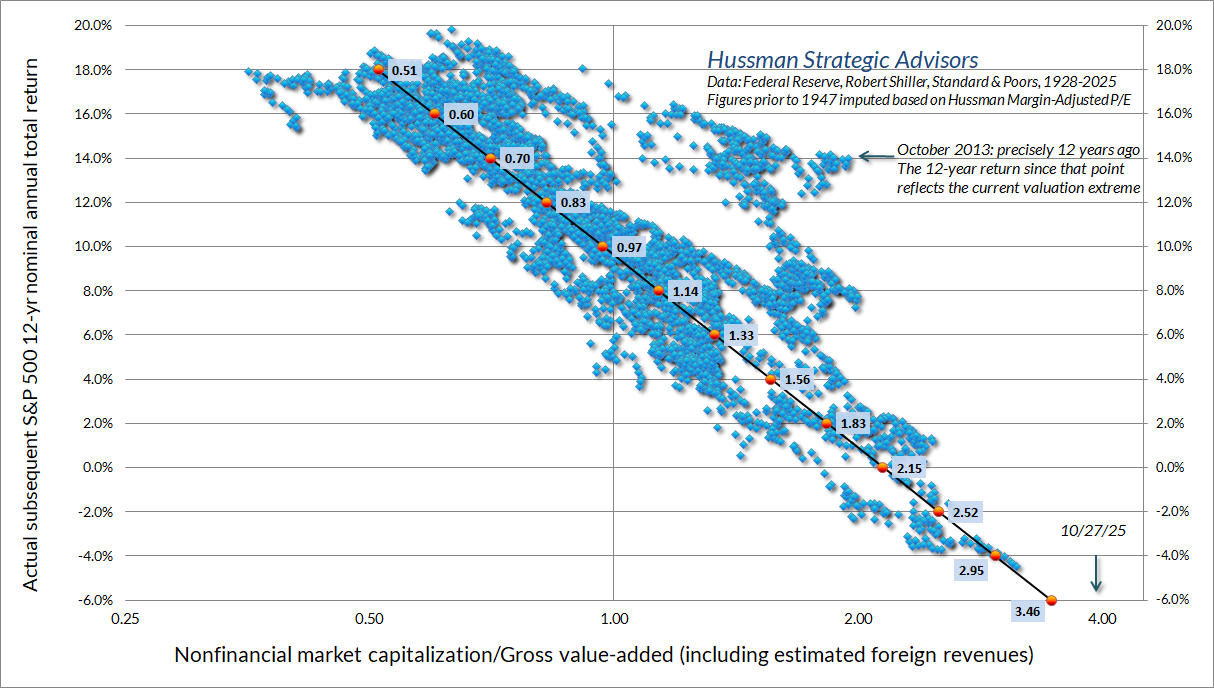
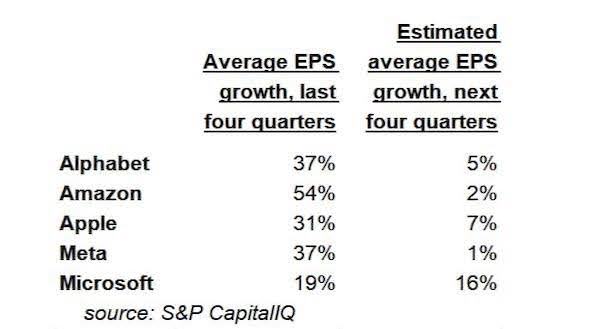
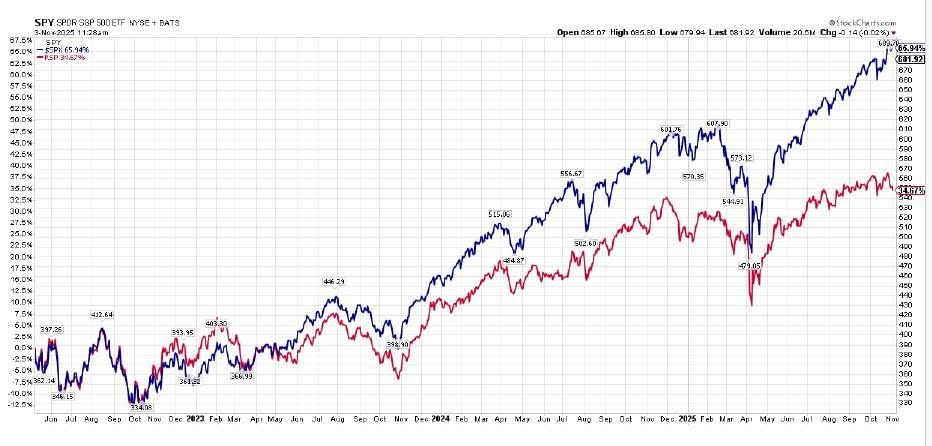
During stock market bubbles, investors become convinced markets can only rise. Justifications for high valuations such as it is a “New Era” (1920’s), a “New Economy” (1990’s) or some other new paradigm such as the age of AI (artificial intelligence) has arrived. However, economist John Hussman uses valuation methods with track records of correlation to subsequent returns. In the first graph below, one can see subsequent 12-year nominal average expected returns of below -6% per year from current valuations. Top technology stocks are leading the way for the market; however, the continued rate of growth is in question. (See list of last EPS vs. next EPS estimates) The last graph shows the equal weighted S&P 500 is far below the “regular” cap weighted S&P 500. This concentration along with higher debt levels and rising unemployment makes for a risky environment. Historically in bubbles, valuations do not matter, until suddenly they do!
For further analysis, continue to read The Details below for more information.
“I think there is a mindset among many professional investors that if I go down the drain, well it is o.k. as long as everyone else is going down the drain with me.”
–Jean Marie Eveillard
The Details
For many investors, it is easy to get caught up in the frenzy of asset bubbles. Listening to pundits on financial media explain why there is no bubble, investors become convinced that the good times are here to stay. “Old” methodologies for measuring the reasonableness of stock prices no longer apply. It is said, a “New Era” (1920’s), a “New Economy” (1990’s) or some other new paradigm has arrived, such as the age of AI (artificial intelligence), that changes the rules. Supported, and often initiated, by Fed actions, investors become persuaded that this time is different. However, unless irrationality becomes the norm and price multiples are allowed to grow indefinitely, the cycle will eventually end. And likely it will end in a bust proportional to the level of overvaluation documented by the “old” fundamental valuation methodologies.
The following is from economist John Hussman’s October Market Comment,
“…in his narrative on the Crash of 1929, Andrew Ross Sorkin shared this anecdote,
Roger Babson delivered his message with a greater sense of urgency. ‘Fair weather cannot always continue,’ he told the conferees. ‘The economic cycle is in progress today, as it was in the past. The Federal Reserve System has put the banks in a strong position, but it has not changed human nature. More people are borrowing and speculating today than ever in our history. Sooner or later a crash is coming and it may be terrific.
Babson wasn’t the only one to worry. Walter Sachs, a member of the family that had founded the investment bank Goldman Sachs, had spent the summer in Europe, unaware that the firm’s top banker, Waddill Catchings, had been investing the firm’s public fund, Goldman Sachs Investment Trust, in increasingly risky assets. When he returned to New York, he rushed to Catchings’s apartment to tell him he was ‘crazy.’ Catchings retorted: ‘The trouble with you, Walter, is that you’ve no imagination!’
Andrew Ross Sorkin, 1929”
The following chart, from Hussman’s Market Comment, illustrates what history indicates investors should expect in the future, based upon today’s valuations. This scatter plot documents the valuation level of the S&P 500 (using Hussman’s valuation methodology, nonfinancial market capitalization/gross value added-including estimated foreign revenues) and then plots the actual subsequent 12-year return for the S&P 500. The current valuation level correlates to a subsequent 12-year nominal average return of below -6% per year.
The most recent impetus for enthusiasm in the stock market is the high earnings from a handful of the largest technology companies. The numbers are impressive and would justify high valuations on specific stocks, if only they were able to maintain such earnings. However, the following is via Jesse Felder’s The Felder Report,
“Already, hints of the potential for a large-scale incineration of capital will soon start to appear on Big Tech income statements. ‘All five of the companies’ earnings are expected to slow significantly next year — partly because the past year has been exceptionally good cyclically, and partly (for all of the companies but Apple) because of heavy AI spending,’ reports Robert Armstrong.”
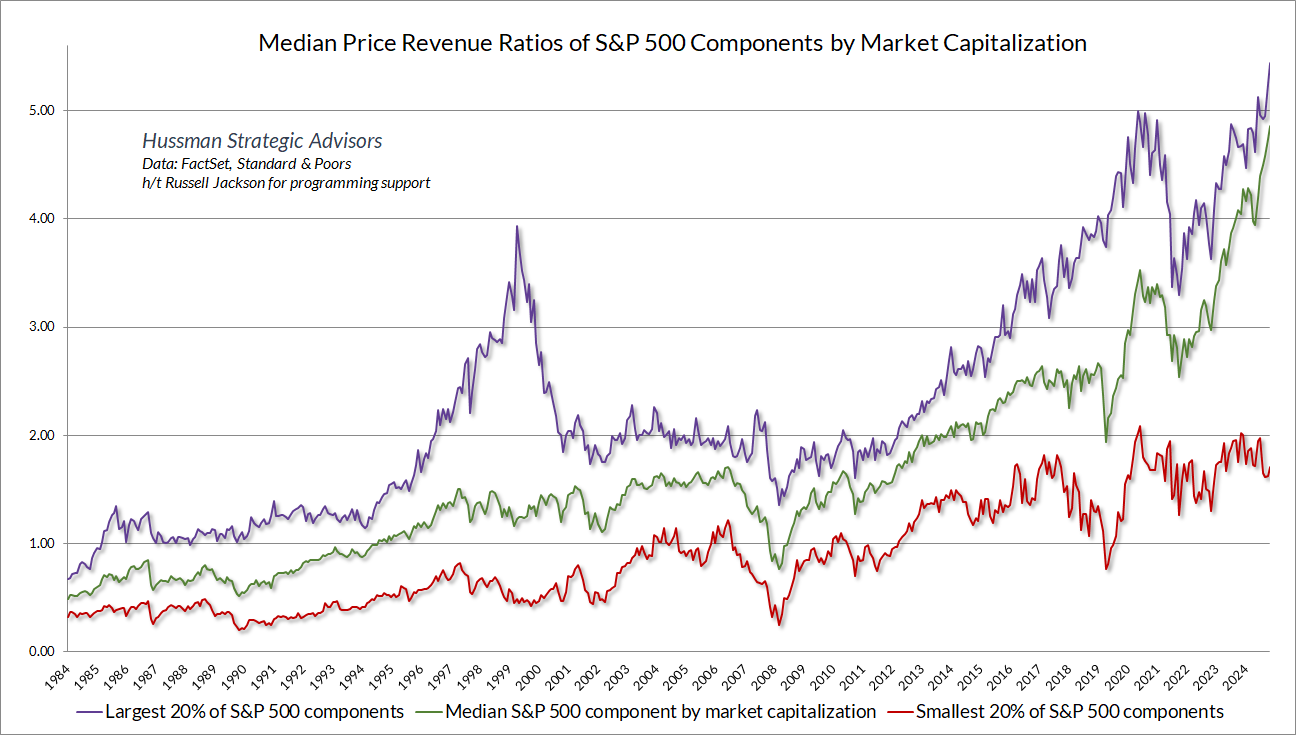
The S&P 500 Index is made up of roughly 500 companies, yet the Index performance is being driven by a handful of companies. The following two graphs illustrate this fact. The first graph is from Hussman’s Market Comment and illustrates the median price-to-revenue ratios for the components of the S&P 500 by market capitalization. Notice how the largest 20% are the priciest.
The price and overvaluation of the S&P 500 are driven by the mega-cap tech companies. This is easy to see when comparing the return of the “regular” cap-weighted S&P 500 (in blue) and the equal-weighted S&P 500 in red in the graph below. The gap between the two is tremendous.
In bubbles, fundamentals are considered irrelevant. Those who refer to them are belittled and told they do not understand the new paradigm the economy and markets have entered. These comments are documented during every major bubble in history. The bubble today is more overvalued and more concentrated than ever before. The risk is enormous, yet investors have been brainwashed into believing this time is different. The following quote was obtained from Hussman’s Market Comment, regarding investor behavior during bubbles.
“So then what do you do to justify valuations? You create a new measure. Indeed, you know it’s a bubble by the math Wall Street uses in these situations. Remember ‘price-to-eyeballs’ during the dot-com bubble? It happens every time. They start dividing prices by things that don’t link up with cash flows. It’s a sign you’re not in Kansas anymore.
It was still necessary to reassure those who required some tie, however tenuous, to reality. The time had come, as in all periods of speculation, when men sought not to be persuaded by the reality of things, but to find excuses for escaping into the new world of fantasy.
– John Kenneth Galbraith, The Great Crash, 1929”
It is now a waiting game. The bubble in stock prices has grown much further than I would have ever believed. I never thought the overvaluations seen in early 2000 would ever have been repeated. Only now it is worse. Higher valuations and incredibly more debt held by investors. Can the bubble continue to inflate? Of course. But investors should remember, justifications sound good…until the consequences arrive.
The S&P 500 Index closed at 6,840, up 0.7% for the week. The yield on the 10-year Treasury
Note rose to 4.10%. Oil prices fell to $61 per barrel, and the national average price of gasoline according to AAA decreased to $3.04 per gallon.
© 2024. This material was prepared by Bob Cremerius, CPA/PFS, of Prudent Financial, and does not necessarily represent the views of other presenting parties, nor their affiliates. This information should not be construed as investment, tax or legal advice. Past performance is not indicative of future performance. An index is unmanaged and one cannot invest directly in an index. Actual results, performance or achievements may differ materially from those expressed or implied. All information is believed to be from reliable sources; however we make no representation as to its completeness or accuracy.
Securities offered through Registered Representatives of Cambridge Investment Research, Inc., a broker/dealer, member FINRA/SIPC. Advisory services offered through Cambridge Investment Research Advisors, Inc., a Registered Investment Advisor. Prudent Financial and Cambridge are not affiliated.
The information in this email is confidential and is intended solely for the addressee. If you are not the intended addressee and have received this message in error, please reply to the sender to inform them of this fact.
We cannot accept trade orders through email. Important letters, email or fax messages should be confirmed by calling (901) 820-4406. This email service may not be monitored every day, or after normal business hours.
