Executive Summary
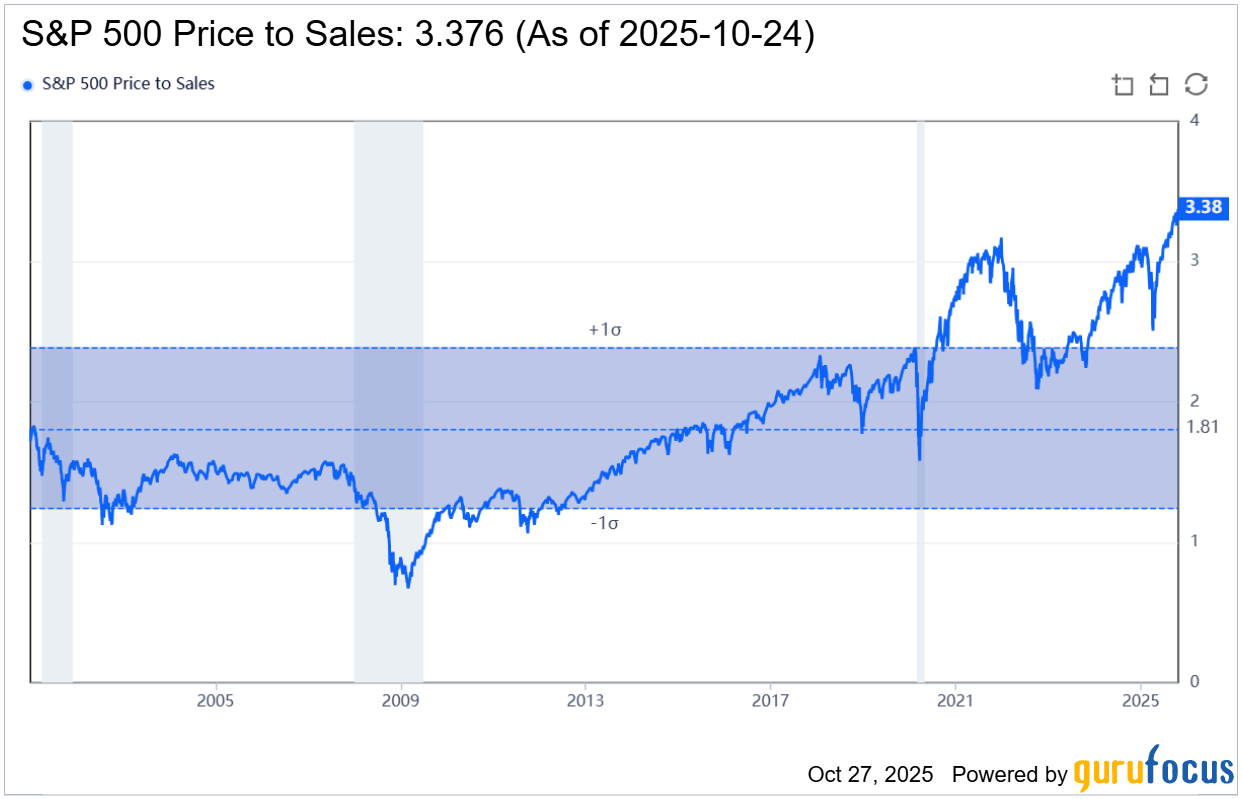
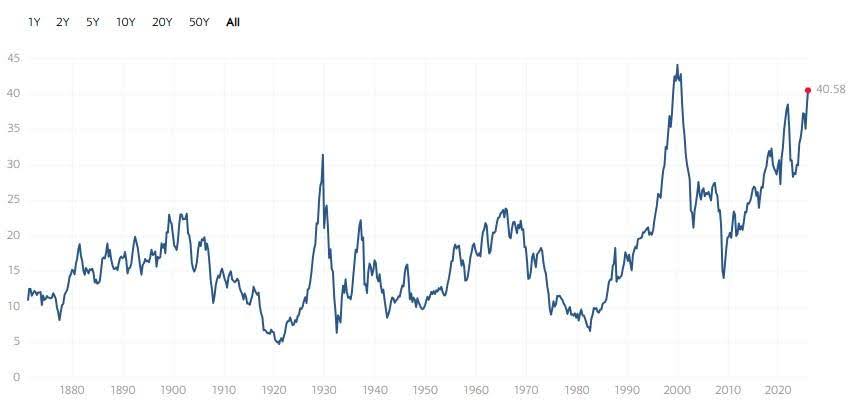
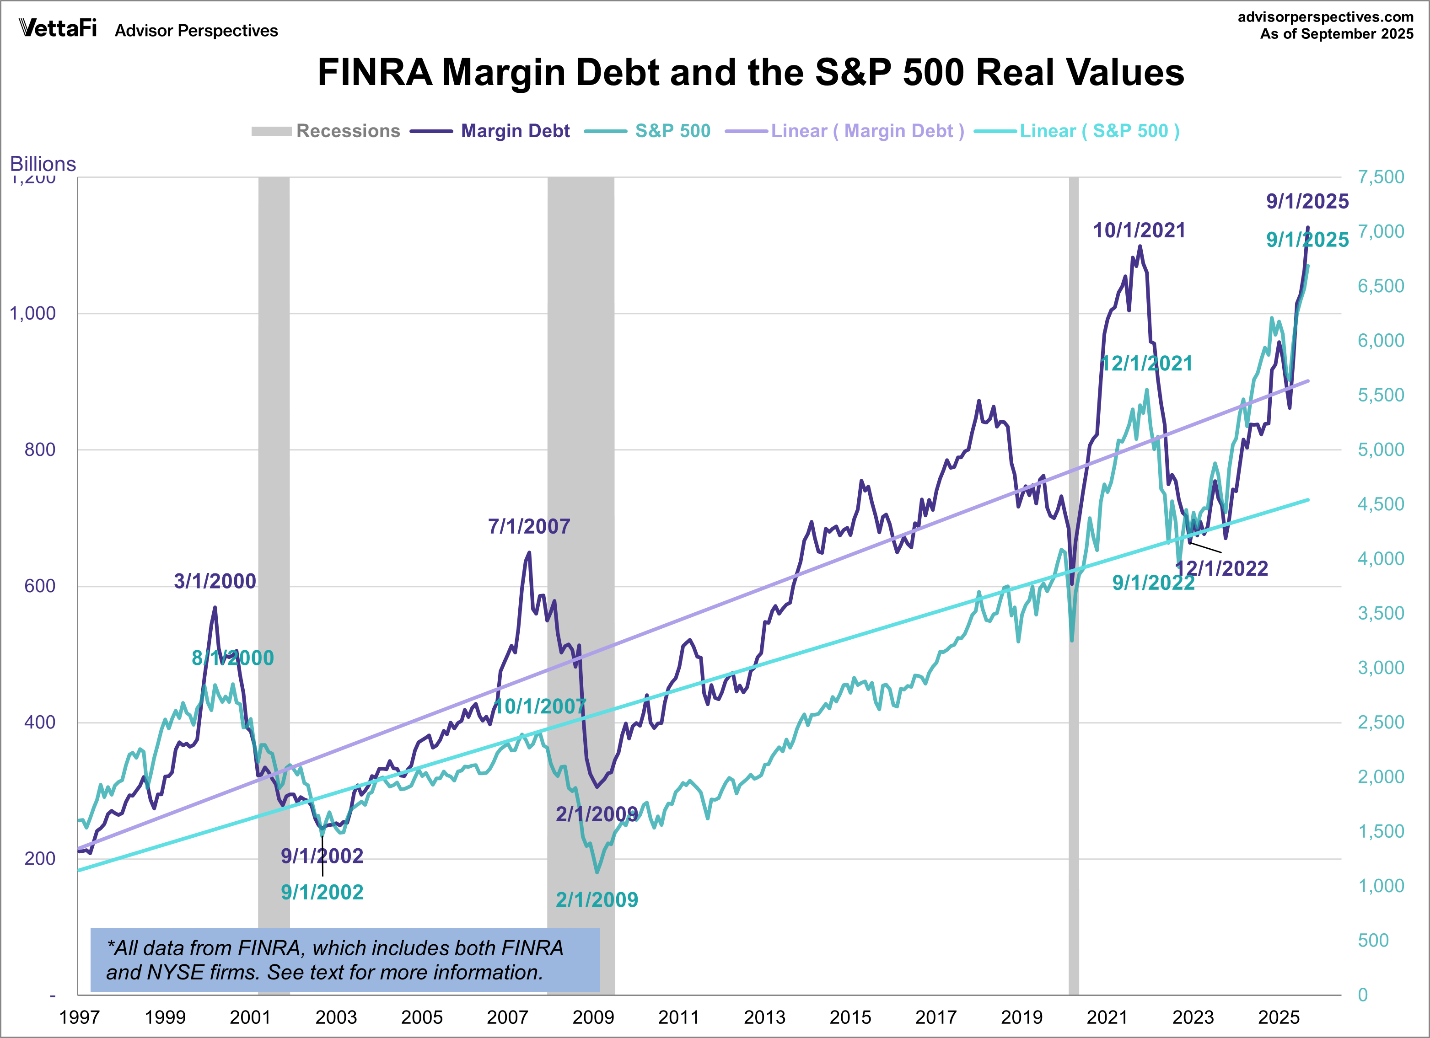
A good measure of the reasonableness of stock market prices is the Price to Sales ratio, mainly because gross sales numbers are hard to manipulate. With a historical average of 1.81, the current 3.38 number (see first graph) is over three standard deviations from the mean. Robert Shiller’s Shiller PE ratio has jumped to 41. For reference, it was 33 in the 1929 peak, 44 in the Technology Bubble peak, and now it is tracking to set a new high. Margin debt is another indicator of the level of speculation in the market. Currently margin debt is 39% higher than a year ago at a whopping $1.13 trillion – which is $80 billion more than all outstanding credit card and revolving credit debt. In summary, speculation and hype in the market are creating much risk to investors. Feel free to give us a call to discuss our Prudent Financial strategies.
For further analysis, continue to read The Details below for more information.
“Yet some basic tendency toward overconfidence appears to be a robust human character trait: the bias is definitely toward over-confidence rather than underconfidence.”
–Robert J. Shiller, Irrational Exuberance
The Details
The absurdity continues to become more absurd. Speculators in this market persist in purchasing stocks at prices relative to fundamentals rarely, if ever, seen. Only now it is worse. One of the best measures of the reasonableness of prices is to compare them to sales. Historically, the S&P 500 Index has traded at an average price of 1.81 times sales. Currently, as shown in the graph below from gurufocus, prices are trading at 3.38 times sales or the highest multiple ever recorded. The price is so elevated that from a statistical standpoint; it is well over three standard deviations from the mean. In English, this level of overvaluation almost never exists.

Another widely accepted valuation method is the PE10, also known as the Shiller PE, named after Yale professor Robert Shiller. This method uses 10-year inflation adjusted earnings to level out the business cycle. During the Technology Bubble this ratio soared to 44, far above the previous peak of 33, reached in September 1929. The irrational prices of technology stocks in 2000 pushed the PE10 to a level no one thought possible, and surely, no one expected would be seen again. Currently, the PE10, as shown below by multpl.com, has jumped to 41. It appears that speculators are attempting to set a new record! It is important to remember that after the Technology Bubble burst, the tech-heavy Nasdaq 100 Index fell 83%.

Like most periods of mania, when speculators get the fever, they tend to go all in. The current period is no different. The level of margin debt used to fund irrational stock purchases has also reached record levels. The chart below from VettaFi illustrates that margin debt has hit $1.13 trillion, a record peak. Margin debt has jumped about 39% since this time last year. Historically, margin peaks have been followed by large corrections in stock prices as margin calls arise.

An interesting observation today is that margin debt now exceeds credit cards and other revolving credit. The current total of credit card and revolving loans is about $1.05 trillion according to the St. Louis branch of the Federal Reserve. This is about $80 billion less than the balance of margin debt.
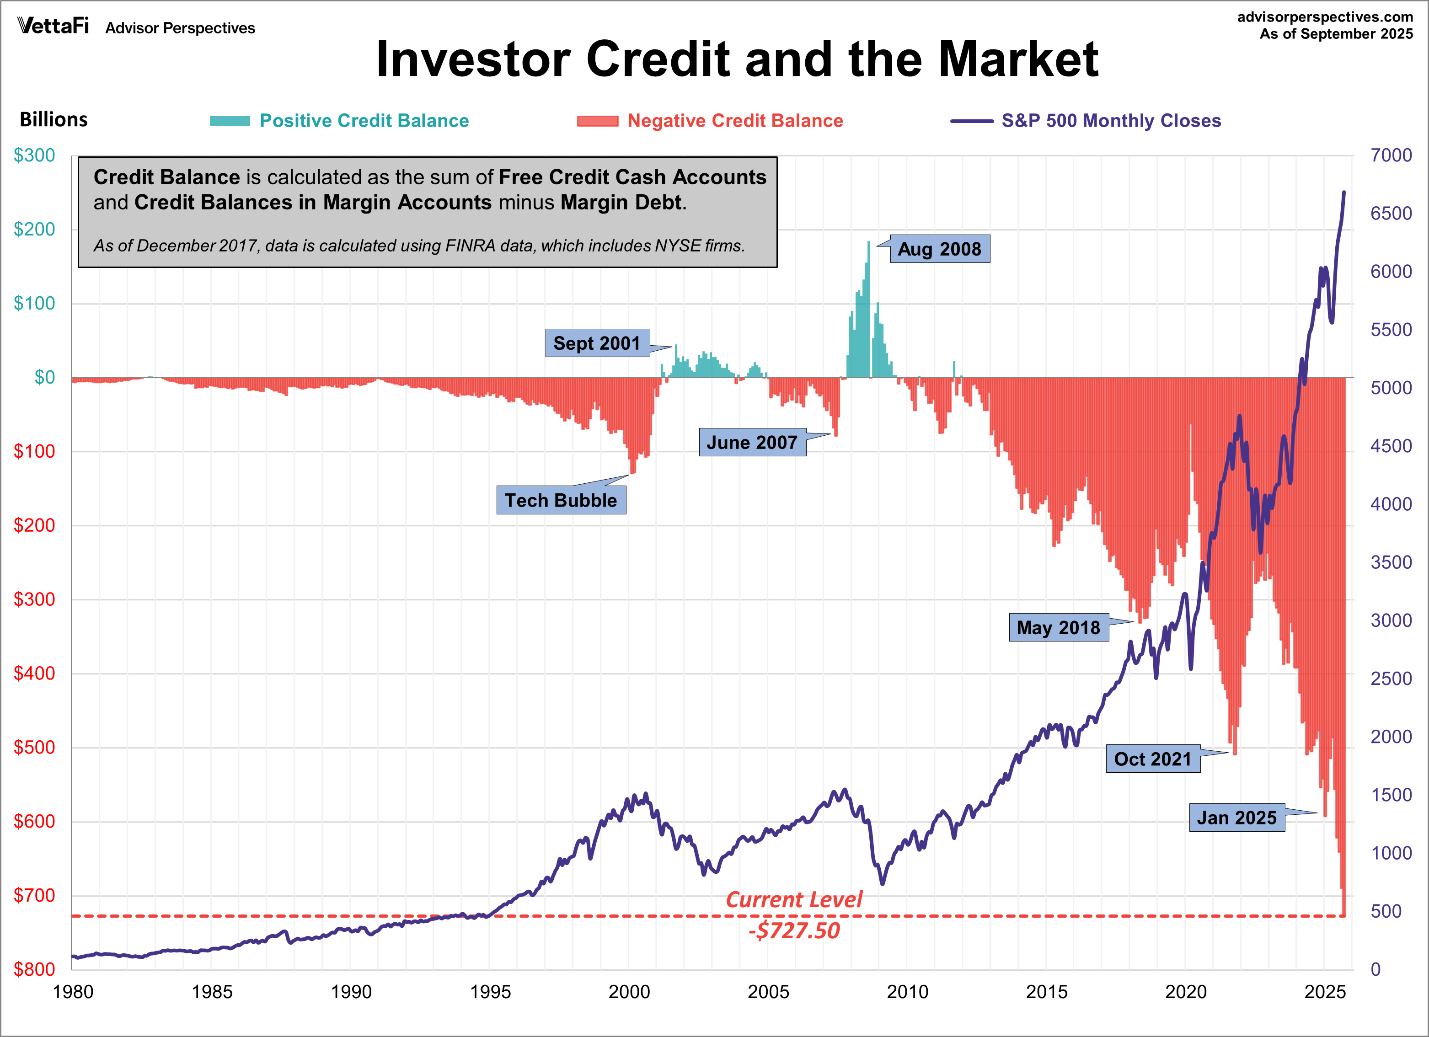
Another way to look at margin debt as described by VettaFi is as follows, “Lance Roberts of Real Investment Advice analyzes margin debt in the larger context that includes free cash accounts and credit balances in margin accounts. Essentially, he calculates the credit balance as the sum of free credit cash accounts and credit balances in margin accounts minus margin debt.”
The graph below overlays the S&P 500 with credit balances. According to the graph, investors have never been more aggressive with a negative credit balance as of September 2025 of $727.50 billion. Together, the above two graphs shows that speculators are “all in”!

Manias spread as speculators and financial media hype the returns achieved as if the returns are sustainable. Believing that “this time is different,” retail investors jump in hoping to participate in the incredibly unjustifiable gains. Soon they discover that this time is not different than every other bubble cycle in history…it just lasted longer and grew higher. When the bubble pops everyone will be running for the same exit. Many will be left holding the bag. Markets have never been so irrational.
The S&P 500 Index closed at 6,792, up 1.9% for the week. The yield on the 10-year Treasury
Note fell to 4.00%. Oil prices rose to $62 per barrel, and the national average price of gasoline according to AAA increased to $3.05 per gallon.
© 2024. This material was prepared by Bob Cremerius, CPA/PFS, of Prudent Financial, and does not necessarily represent the views of other presenting parties, nor their affiliates. This information should not be construed as investment, tax or legal advice. Past performance is not indicative of future performance. An index is unmanaged and one cannot invest directly in an index. Actual results, performance or achievements may differ materially from those expressed or implied. All information is believed to be from reliable sources; however we make no representation as to its completeness or accuracy.
Securities offered through Registered Representatives of Cambridge Investment Research, Inc., a broker/dealer, member FINRA/SIPC. Advisory services offered through Cambridge Investment Research Advisors, Inc., a Registered Investment Advisor. Prudent Financial and Cambridge are not affiliated.
The information in this email is confidential and is intended solely for the addressee. If you are not the intended addressee and have received this message in error, please reply to the sender to inform them of this fact.
We cannot accept trade orders through email. Important letters, email or fax messages should be confirmed by calling (901) 820-4406. This email service may not be monitored every day, or after normal business hours.

