Executive Summary
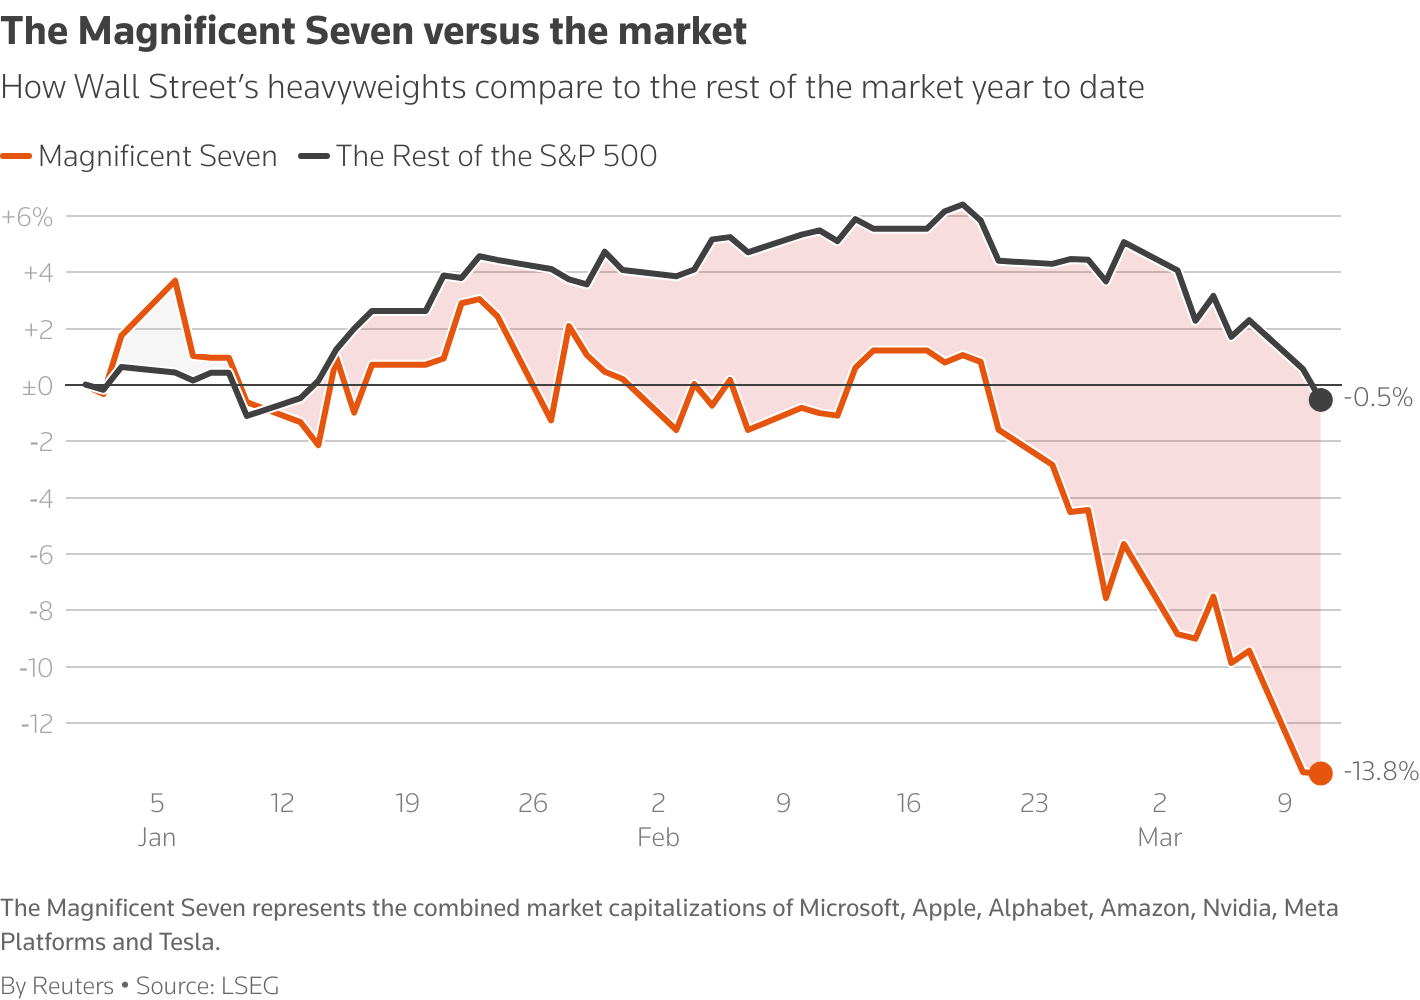
The S&P 500 recently entered “correction” territory after falling 10% by March 13 of this year. Both the rise and the fall of the S&P 500 were led by the Mag 7 stocks. The first graph below illustrates the Mag 7 stocks leading the recent downturn. Since then, the market has recovered by about 4%. However, recognize overall market valuations are still extreme – the Shiller P/E ratio is only down to 35.3 (from 37.5) compared to its long-term median of 16.
For further analysis, continue to read The Details below for more information.
“There are no new eras – excesses are never permanent.”
–Bob Farrell
The Details
Around March 13, the S&P 500 had reached “correction” territory, having fallen about 10% from its peak. Since then, the Index has recouped about 4% of the drop. The sell-off was led by the same Mag 7 stocks – Microsoft, Apple, Alphabet, Amazon, Nvidia, Meta, and Tesla – that lifted markets further into the bubble zone. It is almost ludicrous to hear the concern expressed by such a small drop and listening to the cries to “buy-the-dip”. One has to appreciate the magnitude of the bubble to recognize the absurdity.
The graph below from Reuters illustrates the dominance of the Mag 7 in the recent drop in the S&P 500. The orange line depicts the year-to-date drop in the Mag 7, falling about 14% in the aggregate, while the remaining 493 stocks in the Index were down about 0.5%.

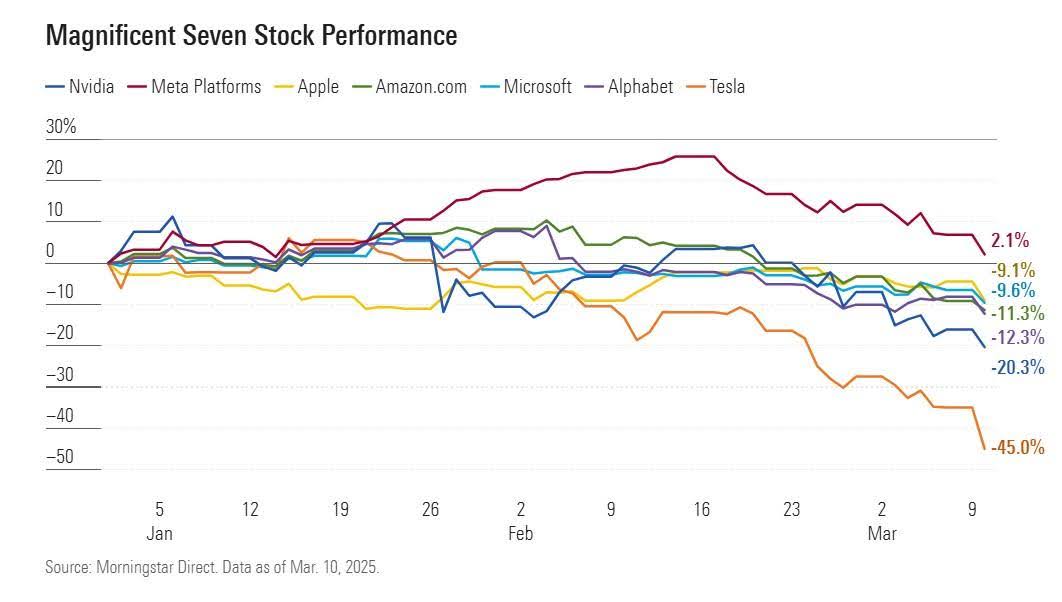
While the year-to-date drop in the Mag 7 was around 14%, the returns of the individual components were varied. Although most of the Mag 7 companies were down in the neighborhood of 10%, Meta was actually up about 2%, while Tesla had plunged 45%. The details can be seen in the graph below from Morningstar.

The recent “correction” in stock prices barely moved the needle on valuations. The Shiller P/E (S&P 500 price / 10-year average, inflation-adjusted, earnings) hit 37.5 in January of this year. The long-term median is 16. The “correction” brought the Shiller P/E down to only 35.3 or 120% above the median. And for reference, the trailing 12-month P/E ratios for the two most overvalued Mag 7 stocks, Nvidia and Tesla, are 41.5 and 134.7, respectively. Suffice it to say the bubble remains intact.
The S&P 500 Index closed at 5,668, up 0.5% for the week. The yield on the 10-year Treasury Note fell to 4.25%. Oil prices rose to $68 per barrel, and the national average price of gasoline according to AAA increased to $3.13 per gallon.
© 2024. This material was prepared by Bob Cremerius, CPA/PFS, of Prudent Financial, and does not necessarily represent the views of other presenting parties, nor their affiliates. This information should not be construed as investment, tax or legal advice. Past performance is not indicative of future performance. An index is unmanaged and one cannot invest directly in an index. Actual results, performance or achievements may differ materially from those expressed or implied. All information is believed to be from reliable sources; however we make no representation as to its completeness or accuracy.
Securities offered through Registered Representatives of Cambridge Investment Research, Inc., a broker/dealer, member FINRA/SIPC. Advisory services offered through Cambridge Investment Research Advisors, Inc., a Registered Investment Advisor. Prudent Financial and Cambridge are not affiliated.
The information in this email is confidential and is intended solely for the addressee. If you are not the intended addressee and have received this message in error, please reply to the sender to inform them of this fact.
We cannot accept trade orders through email. Important letters, email or fax messages should be confirmed by calling (901) 820-4406. This email service may not be monitored every day, or after normal business hours.

