Executive Summary
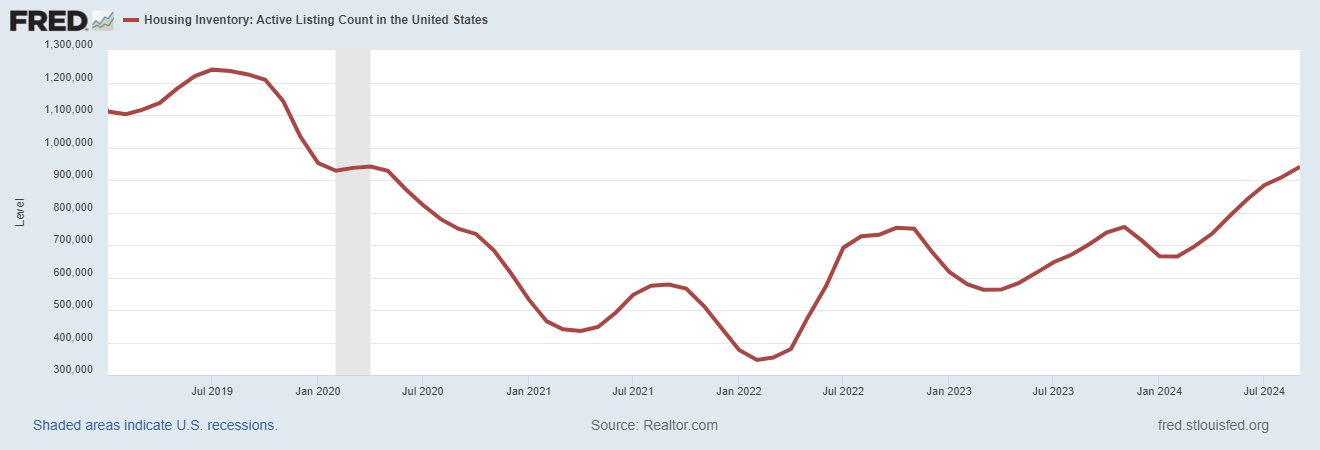
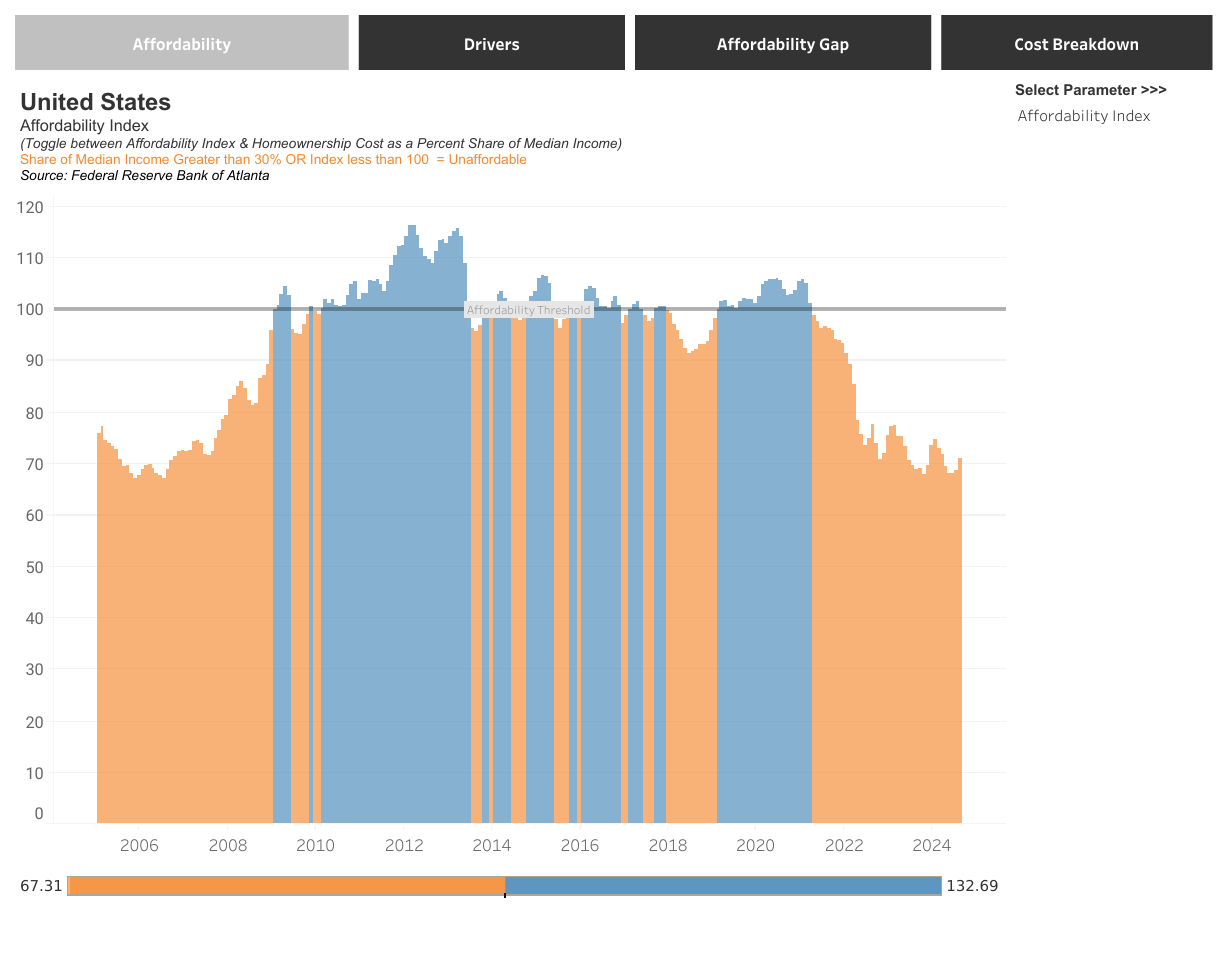
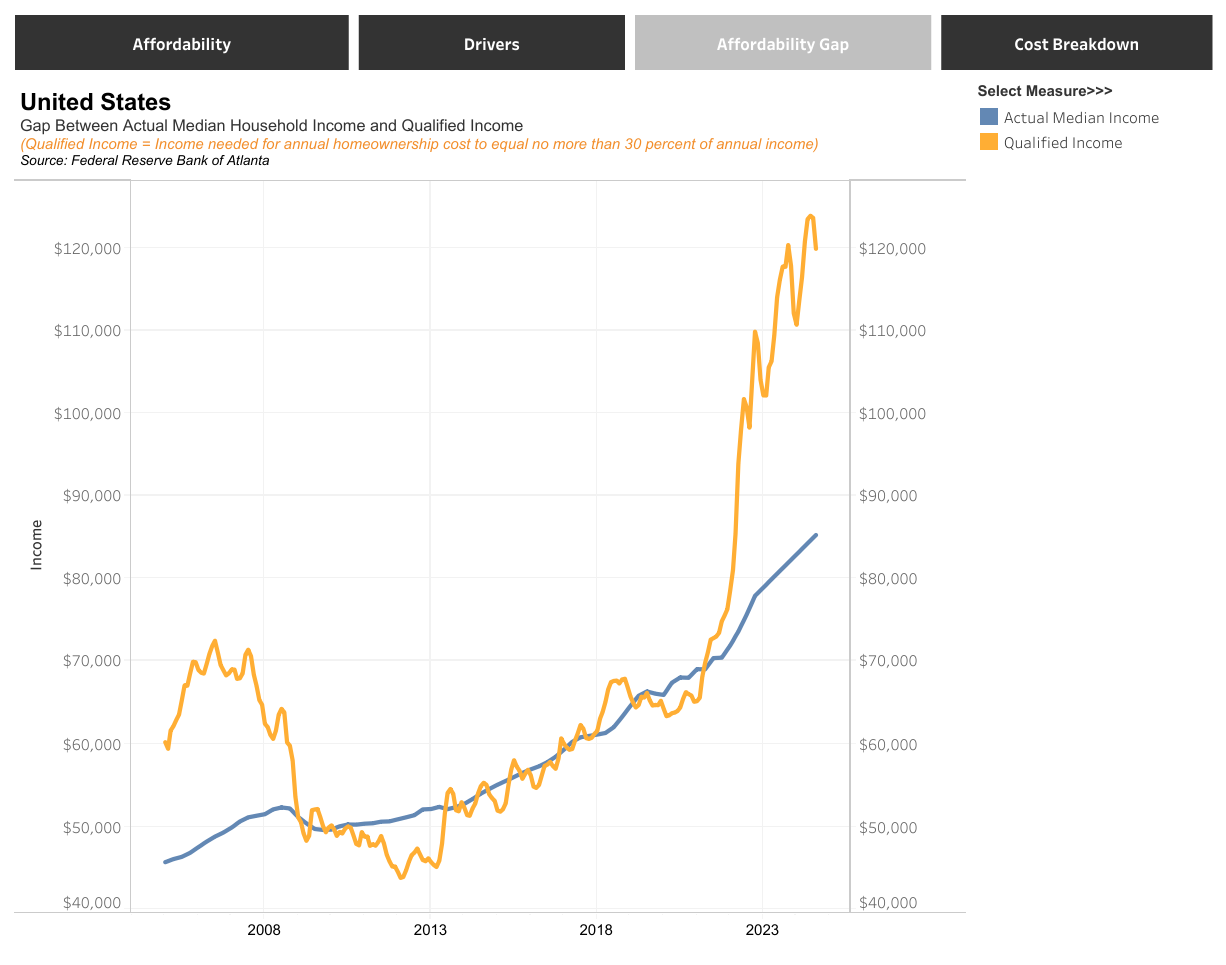
Housing prices have perplexed many since mortgage rates rose in 2023. Since active home listings plummeted from 1.2 million in 2019 to 347,000 in 2022 (see first graph), prices stayed high. Now analyzing housing affordability, one can see it is more unaffordable than in 2007 just before the Financial Crisis (second graph). The third graph shows the gap between actual median household income and the qualified income needed to keep housing costs no more than 30% of annual income, illustrating the unaffordability. While things were worse around 1985 as described below, currently other household debt is also dragging on the consumer. Inventory has jumped 172% since 2022; however, it is still lower than 2019. Housing is local and will vary by each market, various state changes are included below. Overall, a slowing economy could put downward pressure on home prices as inventory grows.
Please proceed to read The Details below for more information.
“Talk is cheap because supply exceeds demand.”
–Anonymous Proverb
The Details
A perfect storm of events in the housing market occurred after the pandemic which added to the already existing housing shortage, keeping inventory low and prices up. Pandemic induced shortages in both materials and labor, and institutional investors buying up homes and turning them into rentals put a strain on housing inventory. After the pandemic stimulus and plunge in mortgage interest rates, existing homeowners used their new-gotten funds to “fix-up” their homes and complete the projects they had always wanted to tackle. Many homeowners refinanced their mortgages with rates as low as 2.75%. Locked into these low rates and in “refurbished” homes, homeowners did not want to sell.
Active home listings, which exceeded 1.2 million in 2019, plunged to a mere 347,000 by 2022. The lack of inventory sent home prices skyrocketing. According to data on the St. Louis Fed FRED database, the median home price in the US rose about 34% between 2020 and the end of 2022. Then, the Fed began raising interest rates in 2022. Higher rates combined with soaring prices slowed housing sales resulting in a rise in inventory. As shown in the graph below, after bottoming in 2022, housing inventory has risen 172% to 941,000 currently.
With prices at nosebleed levels and interest rates high, home affordability is decreasing. The graph below from the Atlanta Fed shows that housing is more unaffordable now than it has been since just before the Financial Crisis in 2007. This graph calculates the percentage of monthly costs of home ownership to median household income. In addition to principal and interest payments, this index includes the cost of property taxes and private mortgage insurance in the monthly cost figures. The affordability threshold is 100. Any reading below that is considered unaffordable.
The chart below, also from the Atlanta Fed, shows the affordability gap. This is the gap between median household income (blue line) and the amount of income needed to keep housing costs no higher than 30% of annual income (orange line).
Although housing is more unaffordable than it has been in years, it is important to note that the primary variable component contributing to monthly costs is the mortgage interest rate. The Fed recently lowered the Fed Funds interest rate by 0.50%. Many people expected mortgage rates to fall, helping spur housing sales. And although mortgage rates have come off of their 2023 high, in October they began to rise again.
The graph below illustrates the increase in the median home price from 1985 to 2022, rising from about $61,000 to around $346,000 (red line). However, notice how even with the surge in mortgage rates since 2022, rates remain far below the level in 1985 (green line).
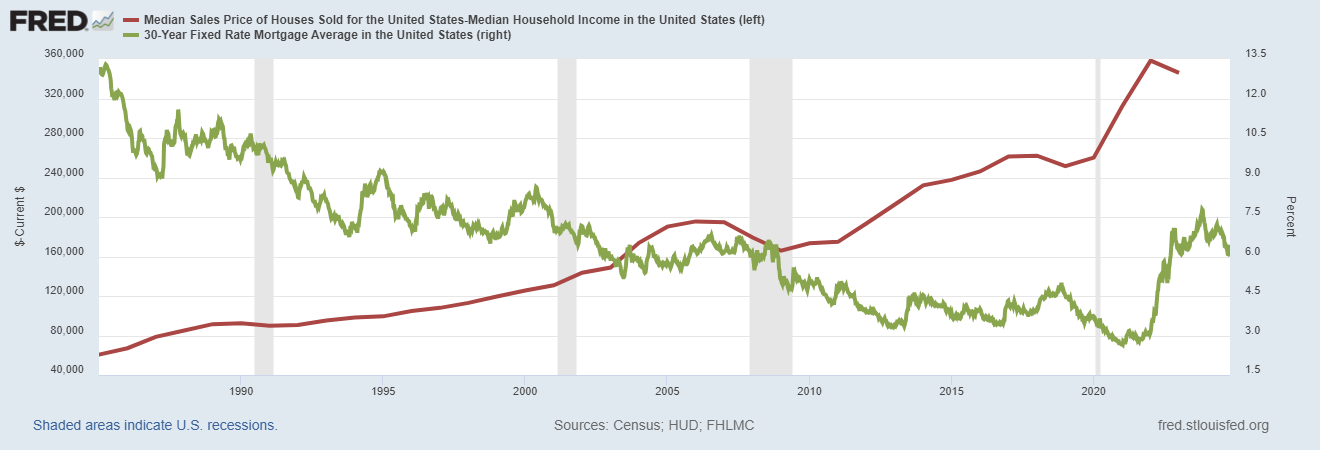
In fact, housing costs were more unaffordable in 1985 than they are today. I am not saying that this in any way alleviates today’s unaffordability. Calculating the percentage of median income consumed by principal and interest payments in 1985 (excluding property taxes and pmi), using the prevailing rate of about 13%, equals over 37%. This compares to about 31% today. This calculation was preformed using data from the St. Louis Fed FRED database. Also, the percentage of median income calculated here excludes property taxes and private mortgage insurance included in the Atlanta Fed analysis shown previously.
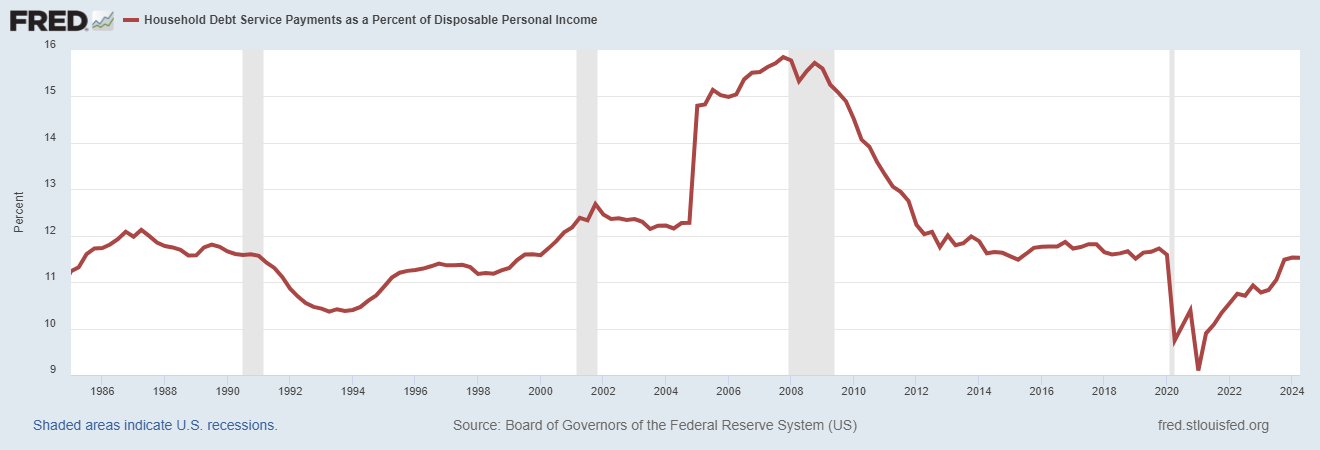
However, overall household debt is up significantly. And even though mortgage interest rates are over 6.5% lower than in 1985, the percentage of household debt service to disposable personal income today is almost as high as in 1985, as shown in the graph below.
Housing inventory has jumped 172% since 2022. According to Reventure.app, some states have seen year-over-year inventory soar over 40%. As an example, housing inventory in Tennessee is up 40%, Georgia 49%, Florida 59% and California 40%. If a recession arrives resulting in significant layoffs, this will add to the upward trend in inventory. As inventory continues to rise, prices will begin to fall. However, it is important to remember that in real estate, everything is local.
I believe that as the economy slows, inventory will continue to pile up. Interest rates could fall initially with an economic slowdown; however, any stimulus enacted to “fix” the slowdown could ignite inflation and add upward pressure to rates. Combined with rising household non-mortgage debt, if rates rise, this will make housing even more unaffordable. This will put downward pressure on home prices. So, I expect housing prices to fall in the future.
The S&P 500 Index closed at 5,865, up 0.9% for the week. The yield on the 10-year Treasury Note fell to 4.08%. Oil prices decreased to $69 per barrel, and the national average price of gasoline according to AAA fell to $3.18 per gallon.
© 2024. This material was prepared by Bob Cremerius, CPA/PFS, of Prudent Financial, and does not necessarily represent the views of other presenting parties, nor their affiliates. This information should not be construed as investment, tax or legal advice. Past performance is not indicative of future performance. An index is unmanaged and one cannot invest directly in an index. Actual results, performance or achievements may differ materially from those expressed or implied. All information is believed to be from reliable sources; however we make no representation as to its completeness or accuracy.
Securities offered through Registered Representatives of Cambridge Investment Research, Inc., a broker/dealer, member FINRA/SIPC. Advisory services offered through Cambridge Investment Research Advisors, Inc., a Registered Investment Advisor. Prudent Financial and Cambridge are not affiliated.
The information in this email is confidential and is intended solely for the addressee. If you are not the intended addressee and have received this message in error, please reply to the sender to inform them of this fact.
We cannot accept trade orders through email. Important letters, email or fax messages should be confirmed by calling (901) 820-4406. This email service may not be monitored every day, or after normal business hours.

