Executive Summary
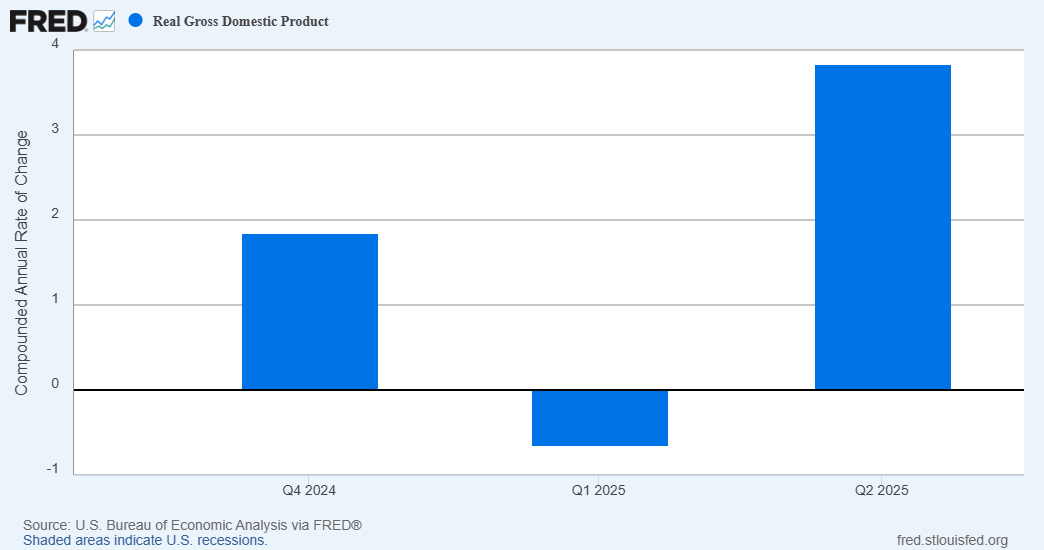
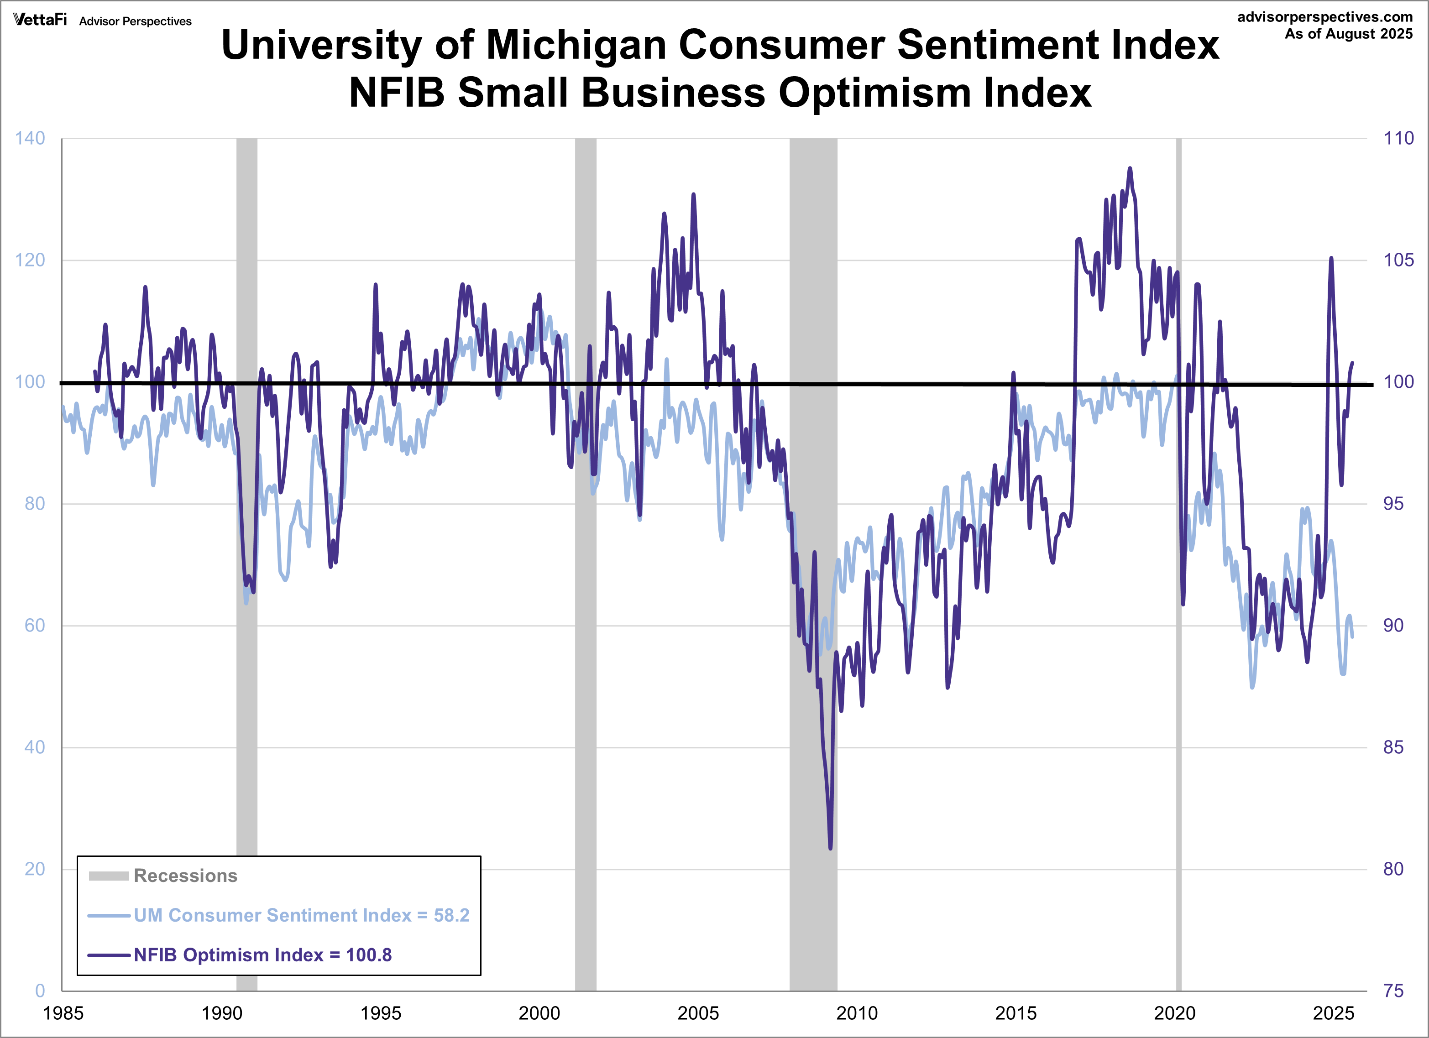
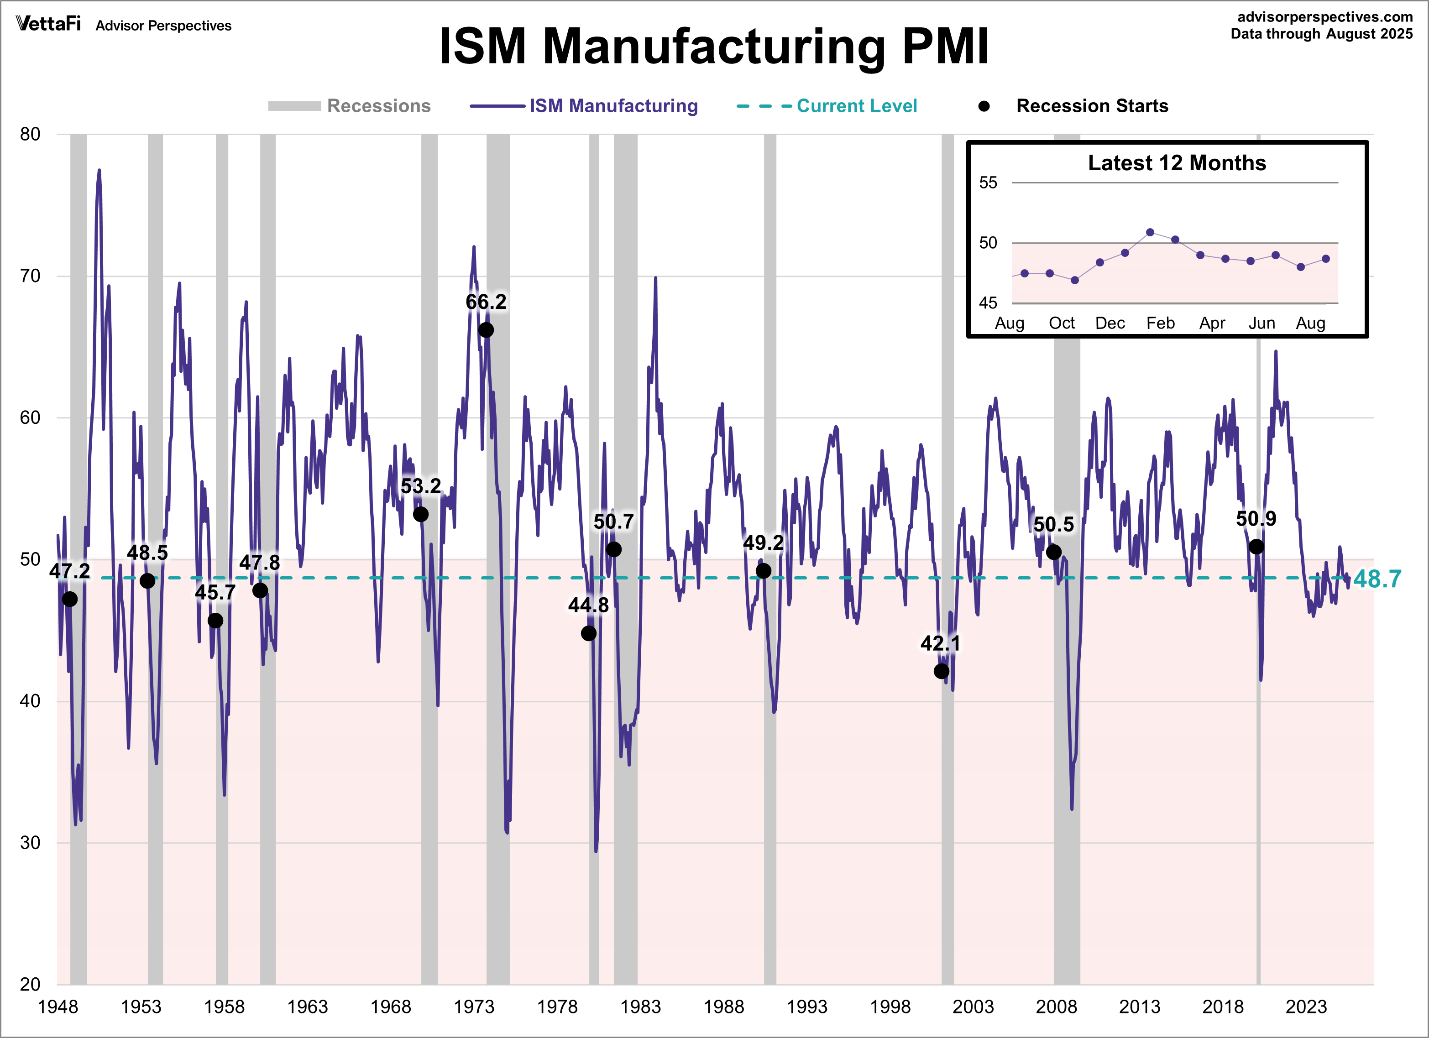
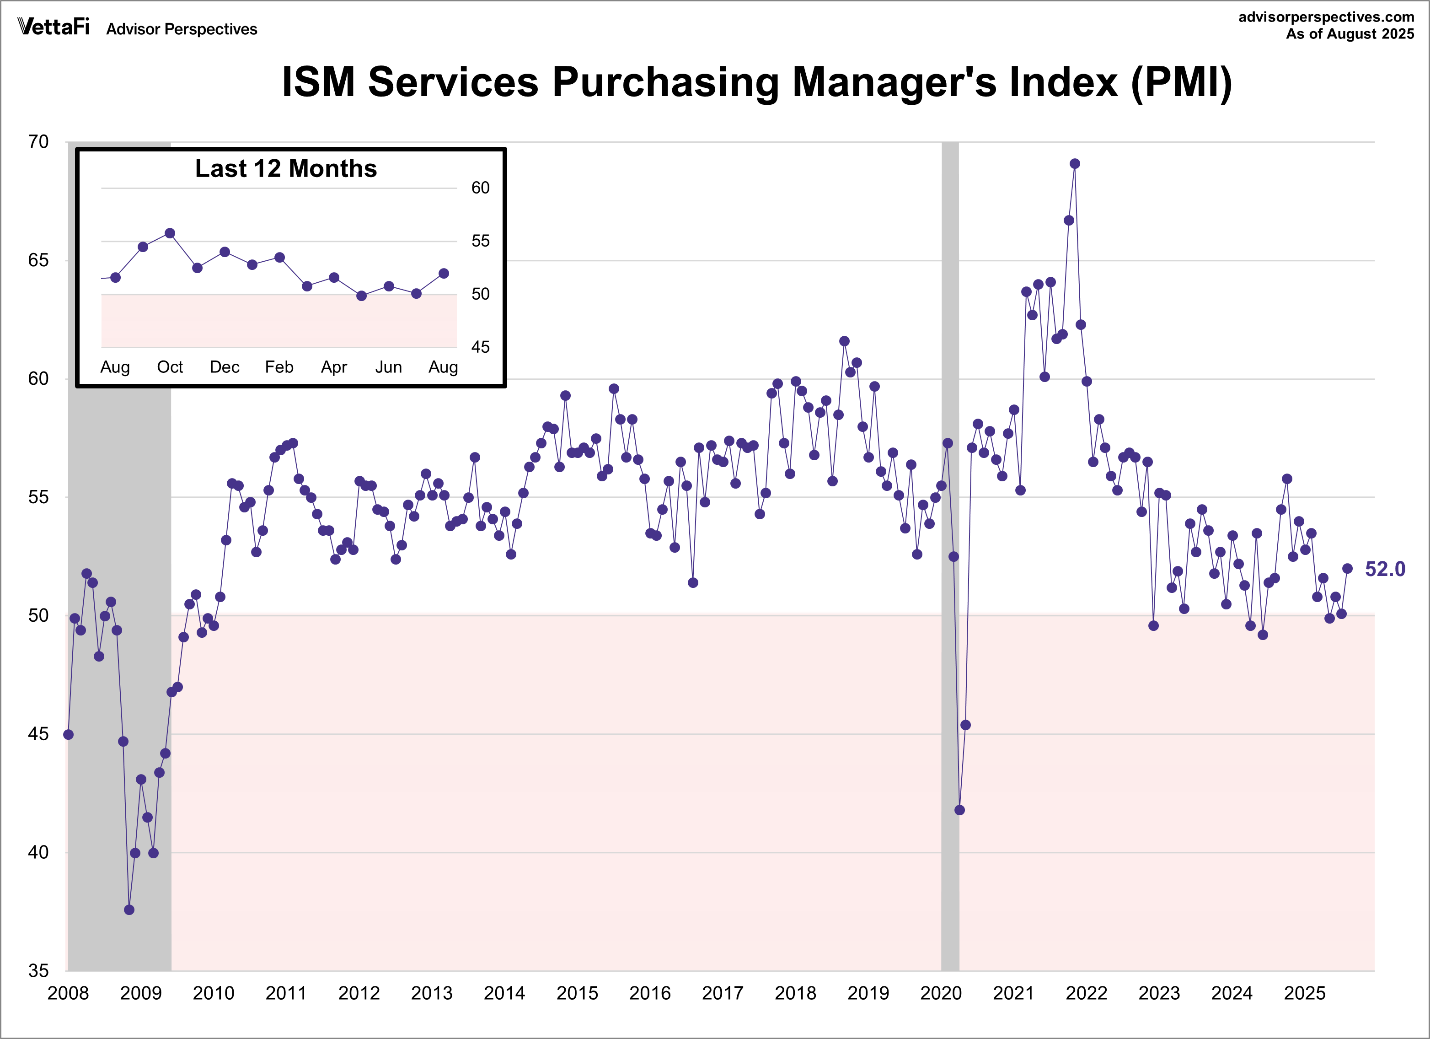
Recently the Bureau of Economic Analysis (BEA) released their final number for second quarter 2025, real annualized GDP growth at 3.8%. Many were stunned at the number, especially when compared to 4th quarter 2024 and first quarter 2025 (see first graph). Recently, a large gap emerged with Consumer Sentiment plunging to recessionary levels, while the NFIB Optimism Index has risen (2nd graph). Both the ISM Manufacturing and Services PMIs are at levels consistent with prior recessions (3rd & 4th graphs). Overall, the economic data seems at odds with the BEA’s calculation of real GDP growth. Economist Mark Skousen recently wrote an opinion piece for The Wall Street Journal. In it he describes a measure of economic activity called GO (Gross Output). This measure shows growth “slowing to a crawl.” And just as with employment data, it appears there are issues with the measurement of economic growth as well.
For further analysis, continue to read The Details below for more information.
“The stock market is a device for transferring money from the impatient to the patient.”
–Warren Buffett
The Details
Recently the Bureau of Economic Analysis (BEA) released their final revision for second quarter 2025 annualized real (inflation-adjusted) gross domestic product (GDP) growth. The revision stunned many people, especially those paying attention to economic data. The final Q2 reading was 3.8% after falling 0.6% in the first quarter. The Q4 2024 final annualized real GDP revision was about 1.8%. The recent announcement made some analysts wonder if the same thing that happened at the BLS – massive downward revisions – could eventually occur at the BEA.
The graph below from Vetta Fi compares the University of Michigan Consumer Sentiment Index with the NFIB (National Federation of Independent Business) Optimism Index.
Notice that historically these indices are fairly well correlated. Recently, a large gap has emerged with Consumer Sentiment plunging to recessionary levels, while the NFIB Optimism Index has risen. This gap will likely narrow with the Optimism Index falling to the Consumer Sentiment Index level.
The ISM Manufacturing PMI (Purchasing Manager’s Index) is below 50, indicating a contraction in manufacturing. The current level is consistent with many prior recessions.
The ISM Services PMI has been hovering around the 50 demarcation level for some time. Although, slightly above at 52 presently, it remains at levels consistent with a recession, as shown in the graph below.
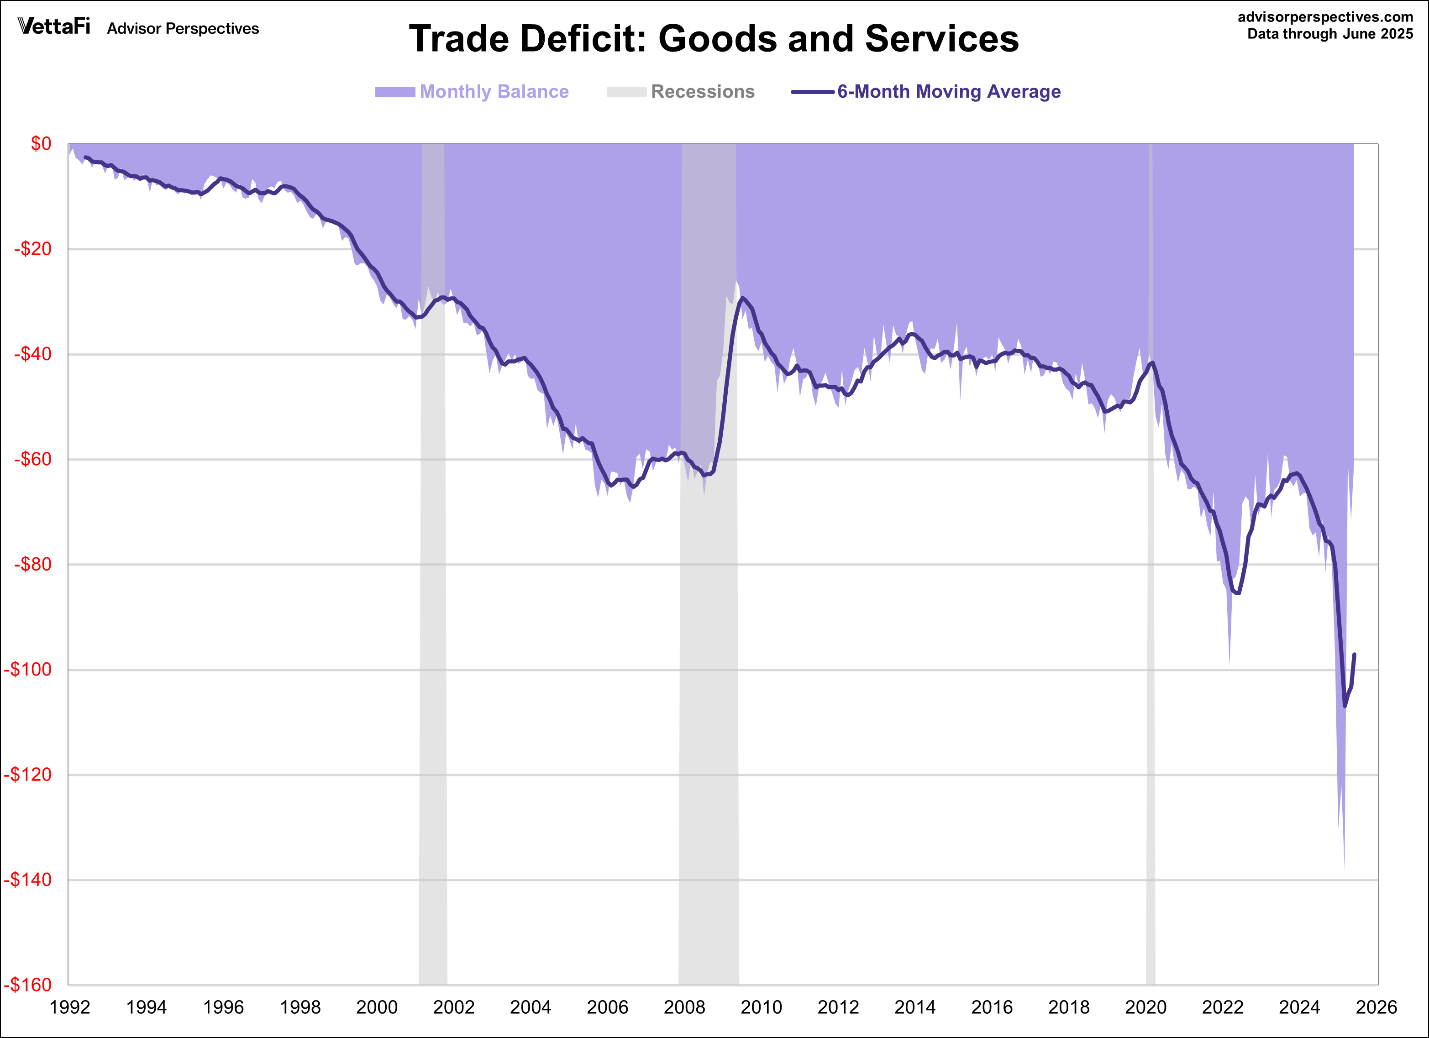
The formula for GDP includes Consumption plus Investment plus Government spending plus Net Exports. Running a trade deficit means that more goods and services are imported versus exported resulting in a reduction in GDP. The graph below shows the current massive trade deficit.
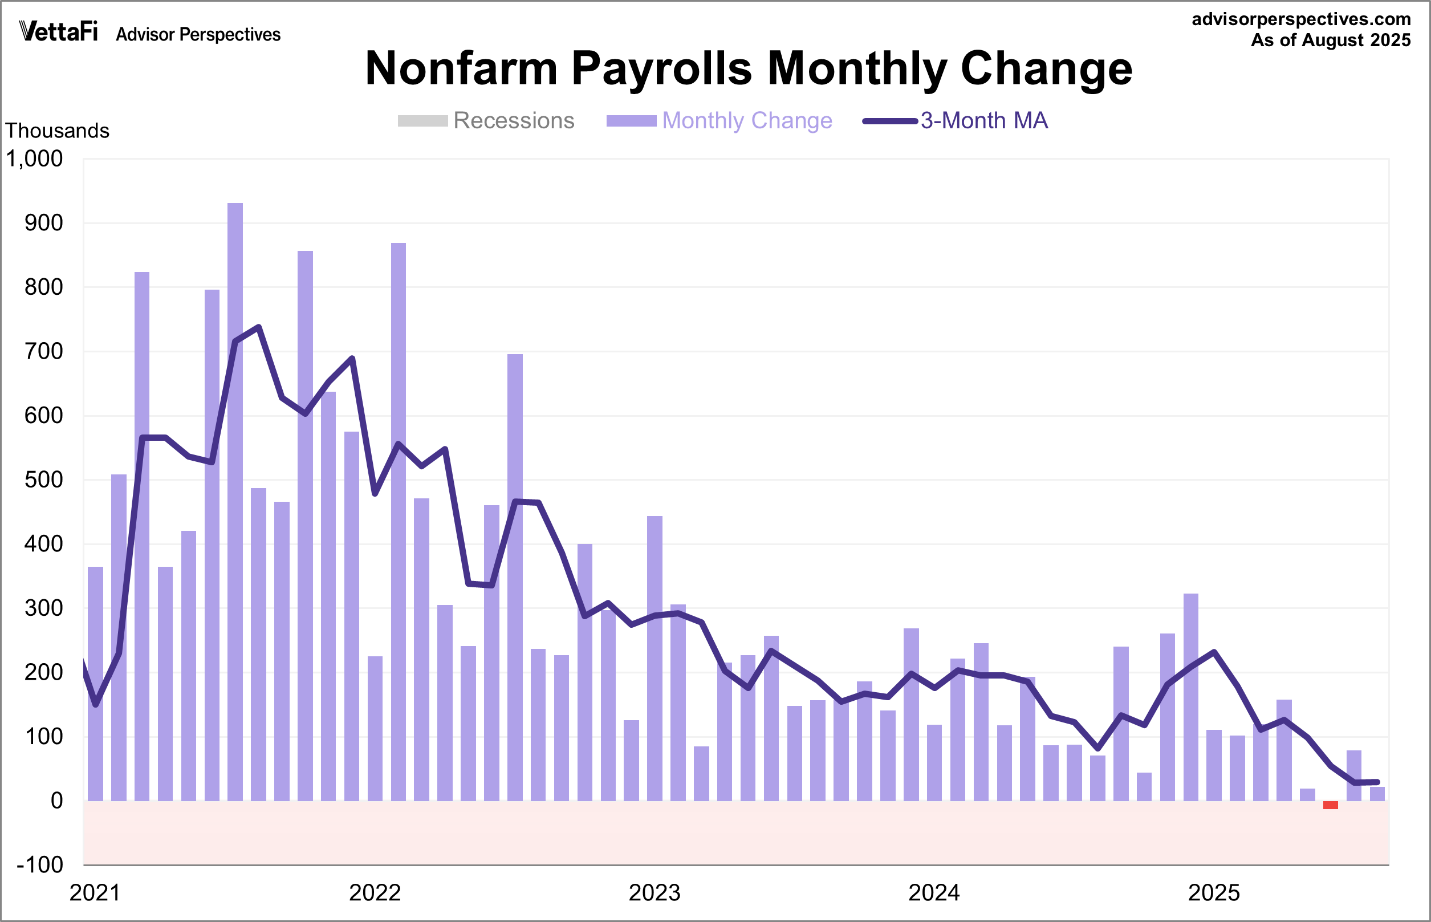
The recent huge downward revision to employment numbers highlighted that the employment picture is much worse than originally presented. The graph below, even before the annual revision, shows an extremely weak employment picture.
Overall, the economic data seems at odds with the BEA’s calculation of real GDP growth. Economist Mark Skousen recently wrote an opinion piece for The Wall Street Journal entitled, “Beneath the GDP, a Recession Warning.” In this article he claims that a far better measure of overall economic activity is GO or Gross Output. GO measures spending at all stages of production, not just the final stage. According to Mr. Skousen, “GO revealed that economic growth is slowing to a crawl, ahead only 1.2% in real terms. If you include all transactions in wholesale and retail trade, the adjusted GO is up only 0.63%. More important, overall business spending fell sharply, by an annualized 5.6% in real terms. These results are much more consistent with the weak labor-market date.”
Just as with the employment data, it appears there are some issues with the measurement of economic growth. The data seems to indicate one thing, while the GDP announcement states another. Which is correct? We will have to wait and see.
The S&P 500 Index closed at 6,644, down 0.3% for the week. The yield on the 10-year Treasury
Note rose to 4.19%. Oil prices increased to $66 per barrel, and the national average price of gasoline according to AAA fell to $3.13 per gallon.
© 2024. This material was prepared by Bob Cremerius, CPA/PFS, of Prudent Financial, and does not necessarily represent the views of other presenting parties, nor their affiliates. This information should not be construed as investment, tax or legal advice. Past performance is not indicative of future performance. An index is unmanaged and one cannot invest directly in an index. Actual results, performance or achievements may differ materially from those expressed or implied. All information is believed to be from reliable sources; however we make no representation as to its completeness or accuracy.
Securities offered through Registered Representatives of Cambridge Investment Research, Inc., a broker/dealer, member FINRA/SIPC. Advisory services offered through Cambridge Investment Research Advisors, Inc., a Registered Investment Advisor. Prudent Financial and Cambridge are not affiliated.
The information in this email is confidential and is intended solely for the addressee. If you are not the intended addressee and have received this message in error, please reply to the sender to inform them of this fact.
We cannot accept trade orders through email. Important letters, email or fax messages should be confirmed by calling (901) 820-4406. This email service may not be monitored every day, or after normal business hours.

