Executive Summary
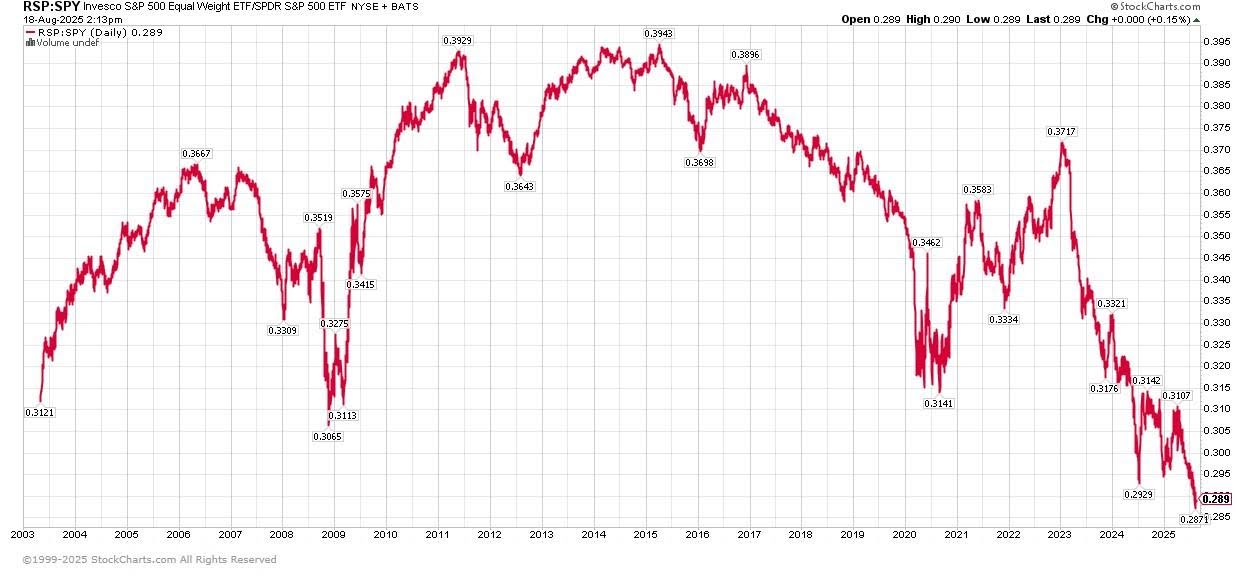
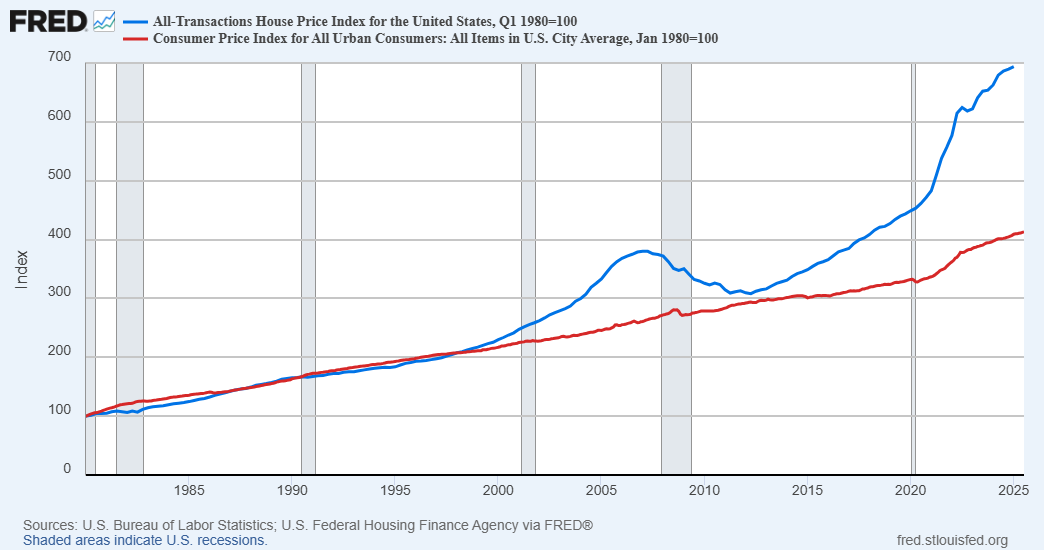
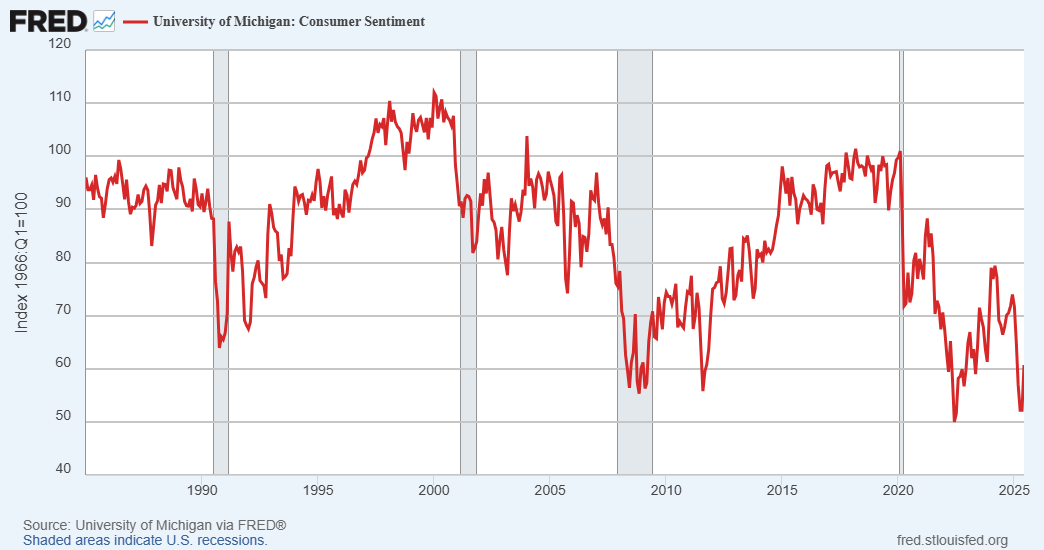
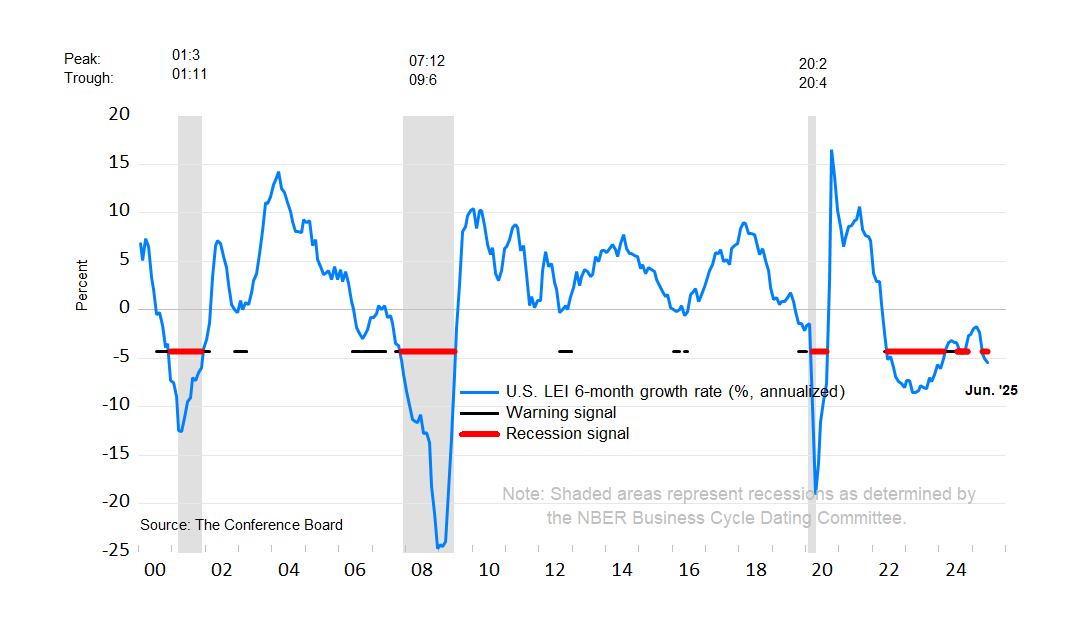
This week includes a number of data points for our readers to ponder. First the concentration risk in the S&P 500, evidenced by the first graph, which shows the largest capitalization stocks in the S&P 500 Index have never been priced this high relative to rest of the Index. Next home prices, as seen in the second graph, have outpaced CPI more than in the 2008 Financial Crisis. The University of Michigan Consumer Sentiment Index is now at or below levels only seen during previous recessions (third graph). And the Conference Board’s Leading Economic Index (LEI) is signaling a recession (4th graph). Lastly, the cracks in the jobs market are evidenced by the new jobs report being revised lower every month this year. From January through June, the total downward revisions represent a 47% reduction in the initially reported jobs numbers. While the full descriptions are included in The Details below, these are things that make you think “Hmmm!”
For further analysis, continue to read The Details below for more information.
“Statistics: The only science that enables different experts using the same figures to draw different conclusions.”
–Evan Esar
The Details
Currently, there are differing opinions about the state of financial markets and the economy. In this missive, I will show a number of graphs and other data, to shed some light on the present situation. Below are some facts which might make you go, “Hmmm.”
Following up on last week’s newsletter, highlighting the concentration risk in the stock market, the following graph shows the equal weighted S&P 500 exchange traded fund (RSP) divided by the market capitalization weighted S&P 500 etf (SPY). Notice that from early 2003 to now, the ratio has never been lower. This means that the largest capitalization stocks in the S&P 500 Index have never been priced as high relative to rest of the Index. Pre-Covid, the only times it was anywhere close to this level were in times of crisis.
In the residential real estate market, prices have never been more overvalued. Home prices historically have tracked inflation. The graph below shows the disconnect from the Consumer Price Index (CPI) is greater now than during the last real estate bubble leading up to the Financial Crisis. The reasons for the current real estate bubble might be different than the prior bubble, but the fact remains that prices are grossly overvalued.
When interest rates were near zero percent, consumers began loading up on debt. With interest rates significantly higher and the jobs market tightening, the consumer outlook has turned sour. In the graph below, the University of Michigan Consumer Sentiment Index is now at or below levels only seen during previous recessions.
Looking at the state of the economy, the Conference Board’s Leading Economic Index (LEI) is signaling a recession. The current level, as shown in the graph below, has never been this low prior to 2022, outside of a recession. Could the economy already be in a recession?
According to USDebtClock.org, the total National Debt recently surpassed $37 trillion, now reading about $37.25 trillion. The annual fiscal deficit has not returned to pre-Covid levels. The fiscal deficit for 2024 was $1.8 trillion, as broken down in the chart below.
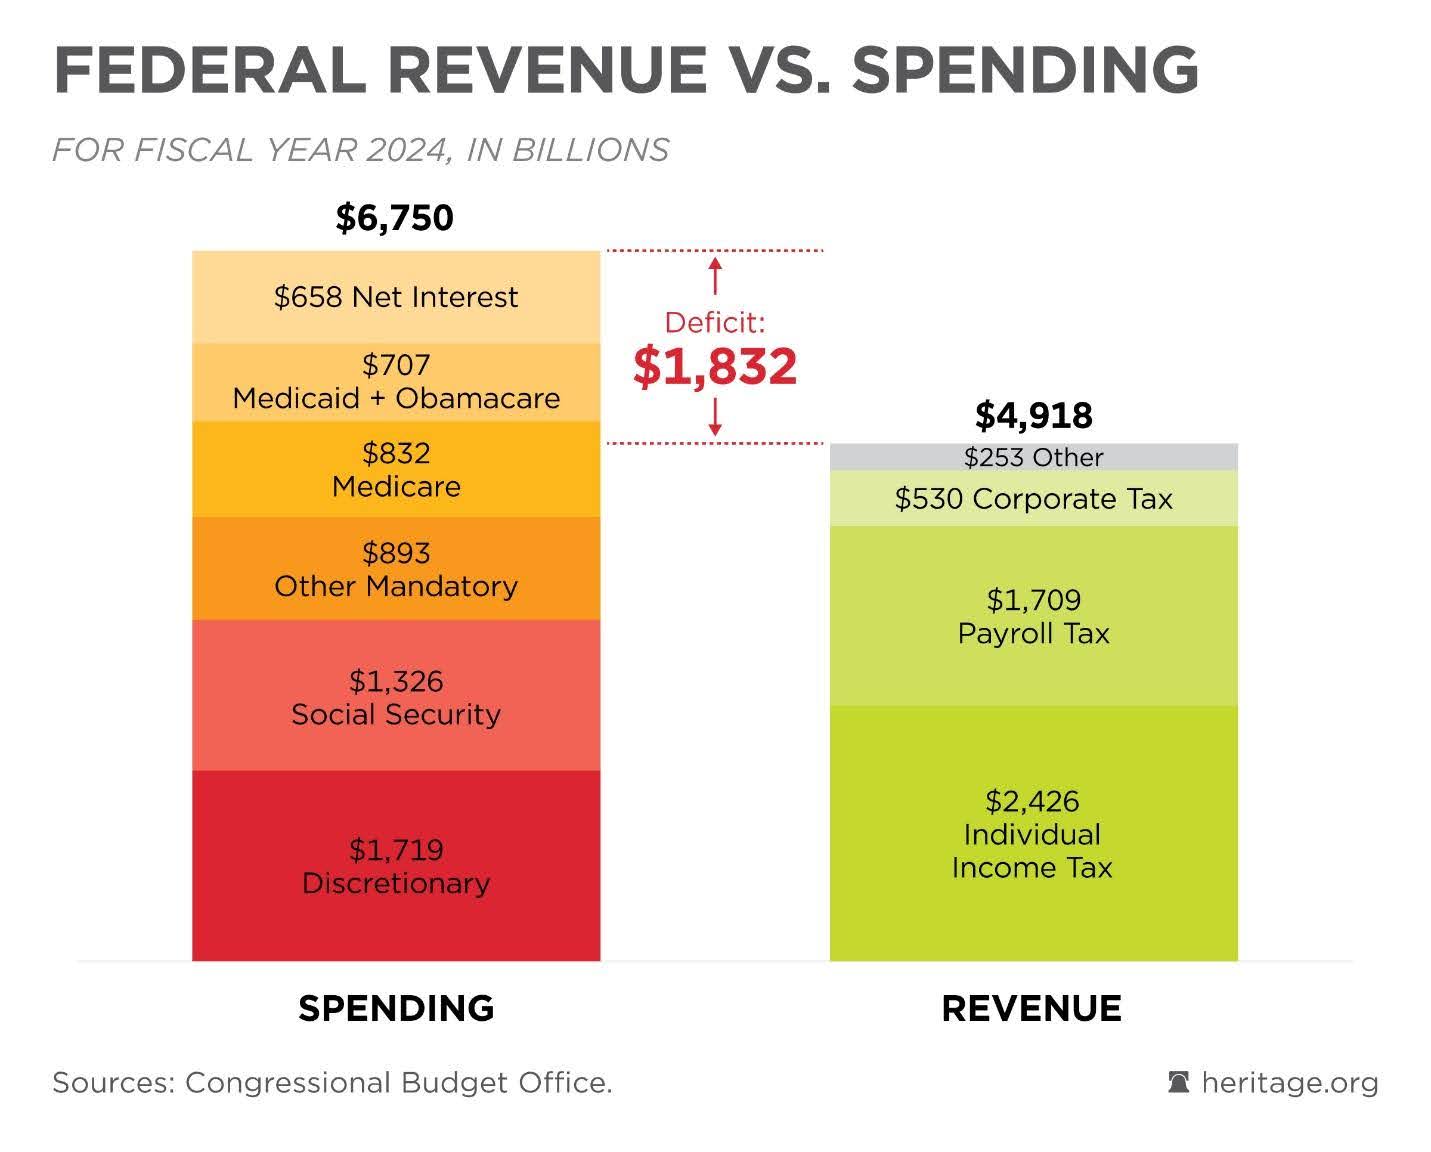
The deficit for the first 10 months of fiscal year 2025, is approximately $1.6 trillion, and is estimated to reach $1.9 trillion by September 30. Hmmm? I thought outside of recessions, the deficit was supposed to fall.
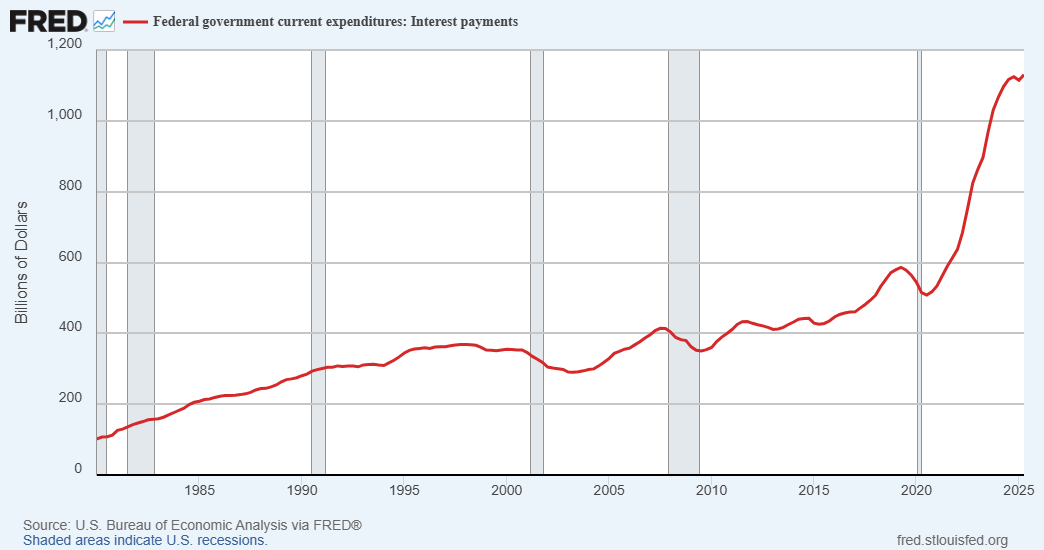
Gross interest payments on the Federal debt, as opposed to net interest shown in the chart above, are over $1.1 trillion annually. On its current trajectory, it will exceed Social Security payments soon. And this is why there is such a push to get interest rates lowered.
The monthly new jobs report has been revised lower every month this year. From January through June, the total downward revisions total about 461,000 jobs, or a whopping 47% reduction in the initially reported jobs numbers.
More troubling, according to Global Markets Investor via X, “US hiring in the private sector is at RECESSION levels:
The US private hiring rate fell to 3.6% in June, one of the lowest levels since the 2020 CRISIS.
This is now in line with the Great Financial Crisis levels and even BELOW the 2001 recession readings.”
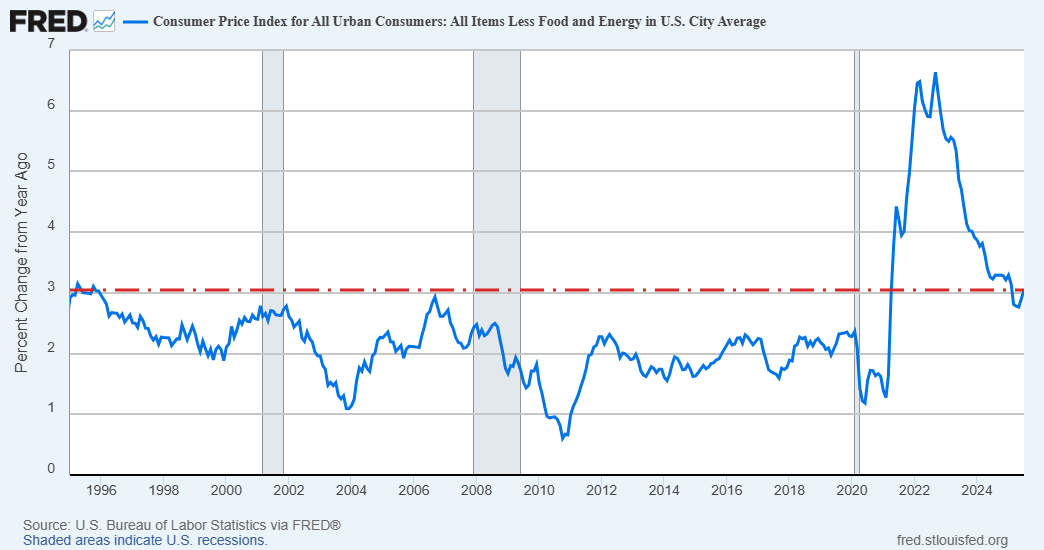
As the debate over whether to expect inflation or deflation, and should the Fed raise or lower interest rates, the following graph shows that core inflation (excluding volatile food and energy costs) has not been higher (pre-Covid) since the end of 1995, almost 30 years ago. And this data does not reflect the full impact of the recently implemented tariffs.
Readers who believe that financial markets are reasonably priced and the economy is strong might be saying, “Hmmm.” The facts above indicate a recessionary economy and record setting bubbles in financial markets. Even both ISM Surveys (manufacturing and services) are in “contraction” territory. Compounding the problem is a massive debt load. Consumers are getting hit with soaring debt-servicing costs. If the jobs market continues to weaken, consumer debt defaults will begin to jump.
I wish I had better news to disclose, but I do not make up the data, I just report it, and then say, “Hmmm.”
The S&P 500 Index closed at 6,450, up 1.0% for the week. The yield on the 10-year Treasury Note rose to 4.33%. Oil prices fell to $63 per barrel, and the national average price of gasoline according to AAA remained at $3.14 per gallon.
© 2024. This material was prepared by Bob Cremerius, CPA/PFS, of Prudent Financial, and does not necessarily represent the views of other presenting parties, nor their affiliates. This information should not be construed as investment, tax or legal advice. Past performance is not indicative of future performance. An index is unmanaged and one cannot invest directly in an index. Actual results, performance or achievements may differ materially from those expressed or implied. All information is believed to be from reliable sources; however we make no representation as to its completeness or accuracy.
Securities offered through Registered Representatives of Cambridge Investment Research, Inc., a broker/dealer, member FINRA/SIPC. Advisory services offered through Cambridge Investment Research Advisors, Inc., a Registered Investment Advisor. Prudent Financial and Cambridge are not affiliated.
The information in this email is confidential and is intended solely for the addressee. If you are not the intended addressee and have received this message in error, please reply to the sender to inform them of this fact.
We cannot accept trade orders through email. Important letters, email or fax messages should be confirmed by calling (901) 820-4406. This email service may not be monitored every day, or after normal business hours.

