Executive Summary
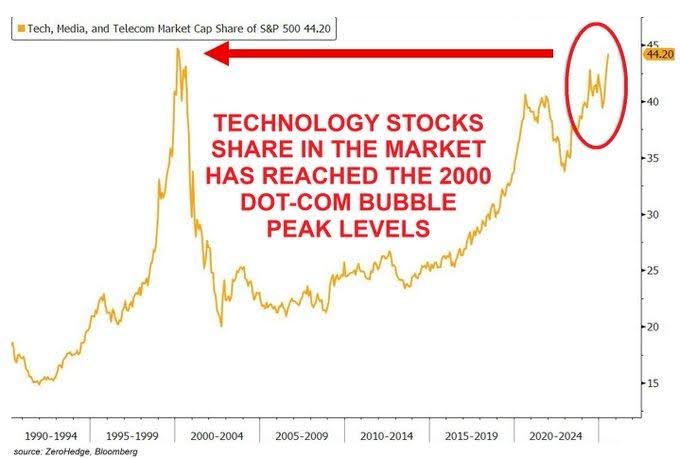
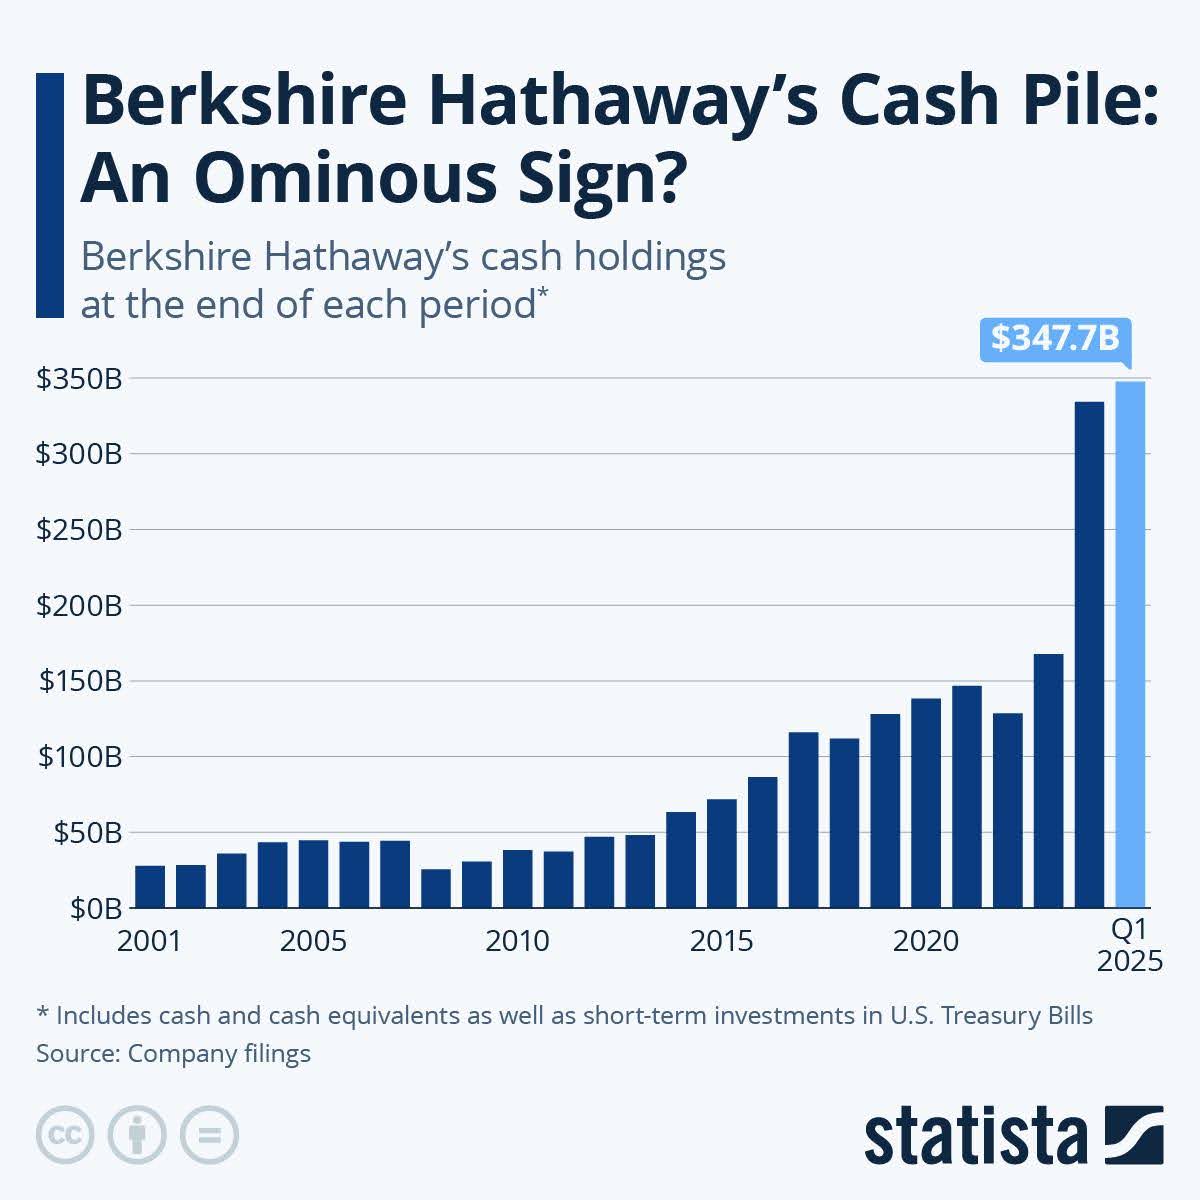
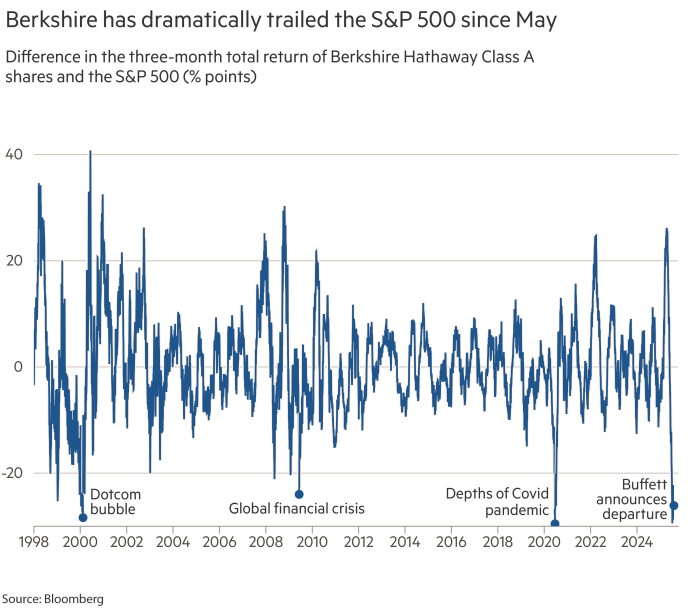
Once again stock prices are pushing record levels. In recent years, investors have seen how the Magnificent 7 have driven up markets. Now, in the first graph, one can see how technology stocks as a share if the market have reached Dot-Com levels. The Schiller P/E and the Buffet Ratio, two valuation metrics, either exceed or are nearing 2000 peaks. Berkshire Hathaway is stockpiling cash (2nd graph) rather than buying stocks at these levels. Historically Berkshire has trailed the S&P 500 before prior peaks (last graph) only to outperform after the crisis. In the event of another crisis, the question is: How fast can one exit?
For further analysis, continue to read The Details below for more information.
“Stocks have reached what looks like a permanently high plateau.”
–Economist Irving Fisher, October 15, 1929
The Details
Once again, stock prices are pushing speculative records. The impermanent pricing levels maintain characteristics similar to those witnessed during the previous all-time overvalued market cycle, reached during the peak of the Technology Bubble in early 2000. The investment firm GMO highlighted, via Jesse Felder, “…it may simply come down to frenzied speculation. ‘Animal spirits are roaring, and strong momentum has pushed both valuations and signs of speculation to risky levels.’”
As shown in the graph below, today’s bubble is just as concentrated as the technology sector was during the Dot-Com era in 2000.

When three non-technology stocks are added to the Mag 7, the concentration levels reach an astounding 40%. According to the article, “Is It Time to Ditch VOO and SPY? Why Betting on the S&P 500 Is Too Risky Today” by Rich Duprey in 247WallStreet.com, “The S&P 500’s concentration in just 10 stocks, representing 40% of its value, makes VOO [Vanguard S&P 500 etf] and SPY riskier than their reputation suggests. Investors are no longer getting the broad market exposure they expect but are instead tethered to the performance of a few tech titans.”
Here are the top 10 concentrated stocks in the S&P 500 Index:
- Nvidia
- Microsoft
- Apple
- Amazon
- Alphabet
- Meta Platforms
- Broadcom
- Berkshire Hathaway
- Tesla
- JPMorgan Chase
From a valuation perspective, the Shiller P/E Ratio, at roughly 38.5, has only been higher at the peak of the Tech Bubble. The Buffett Ratio, on the other hand, is between 20-40% higher than it was during the Tech Bubble, depending upon the methodology used in the calculation.
It is interesting to find Warren Buffett’s Berkshire Hathaway in the top 10 list. Maybe this represents investors bracing for what they see coming. Due to excessive valuations, Berkshire Hathaway has been paring equities and building a stockpile of cash. Notice in the graph below from Statista that their cash holdings are at record levels.

The graph below from the Financial Times compares the three-month total return of Berkshire Hathaway to the S&P 500. Notice that before each of the significant crises since the late 1990’s, when valuations reached absurd levels and/or substantial market risk arose, Berkshire Hathaway’s return greatly lagged the S&P 500. Then, shortly after, when the equity markets suffered large losses, Berkshire Hathaway began to significantly outperform the S&P 500.

Any way you slice it, market valuations are in the stratosphere and being held there by “frenzied speculation.” It appears the “smart money” has recognized this as they move to the safety of cash. While no knows how long the gambling will continue, it is likely the end will rhyme with the end of record speculative cycles of the past. The question speculators should ask is will they be able to beat their fellow gamblers to the exit when someone yells “fire”?
The S&P 500 Index closed at 6,389, up 2.4% for the week. The yield on the 10-year Treasury Note rose to 4.28%. Oil prices decreased to $64 per barrel, and the national average price of gasoline according to AAA dropped to $3.14 per gallon.
© 2024. This material was prepared by Bob Cremerius, CPA/PFS, of Prudent Financial, and does not necessarily represent the views of other presenting parties, nor their affiliates. This information should not be construed as investment, tax or legal advice. Past performance is not indicative of future performance. An index is unmanaged and one cannot invest directly in an index. Actual results, performance or achievements may differ materially from those expressed or implied. All information is believed to be from reliable sources; however we make no representation as to its completeness or accuracy.
Securities offered through Registered Representatives of Cambridge Investment Research, Inc., a broker/dealer, member FINRA/SIPC. Advisory services offered through Cambridge Investment Research Advisors, Inc., a Registered Investment Advisor. Prudent Financial and Cambridge are not affiliated.
The information in this email is confidential and is intended solely for the addressee. If you are not the intended addressee and have received this message in error, please reply to the sender to inform them of this fact.
We cannot accept trade orders through email. Important letters, email or fax messages should be confirmed by calling (901) 820-4406. This email service may not be monitored every day, or after normal business hours.

