Executive Summary
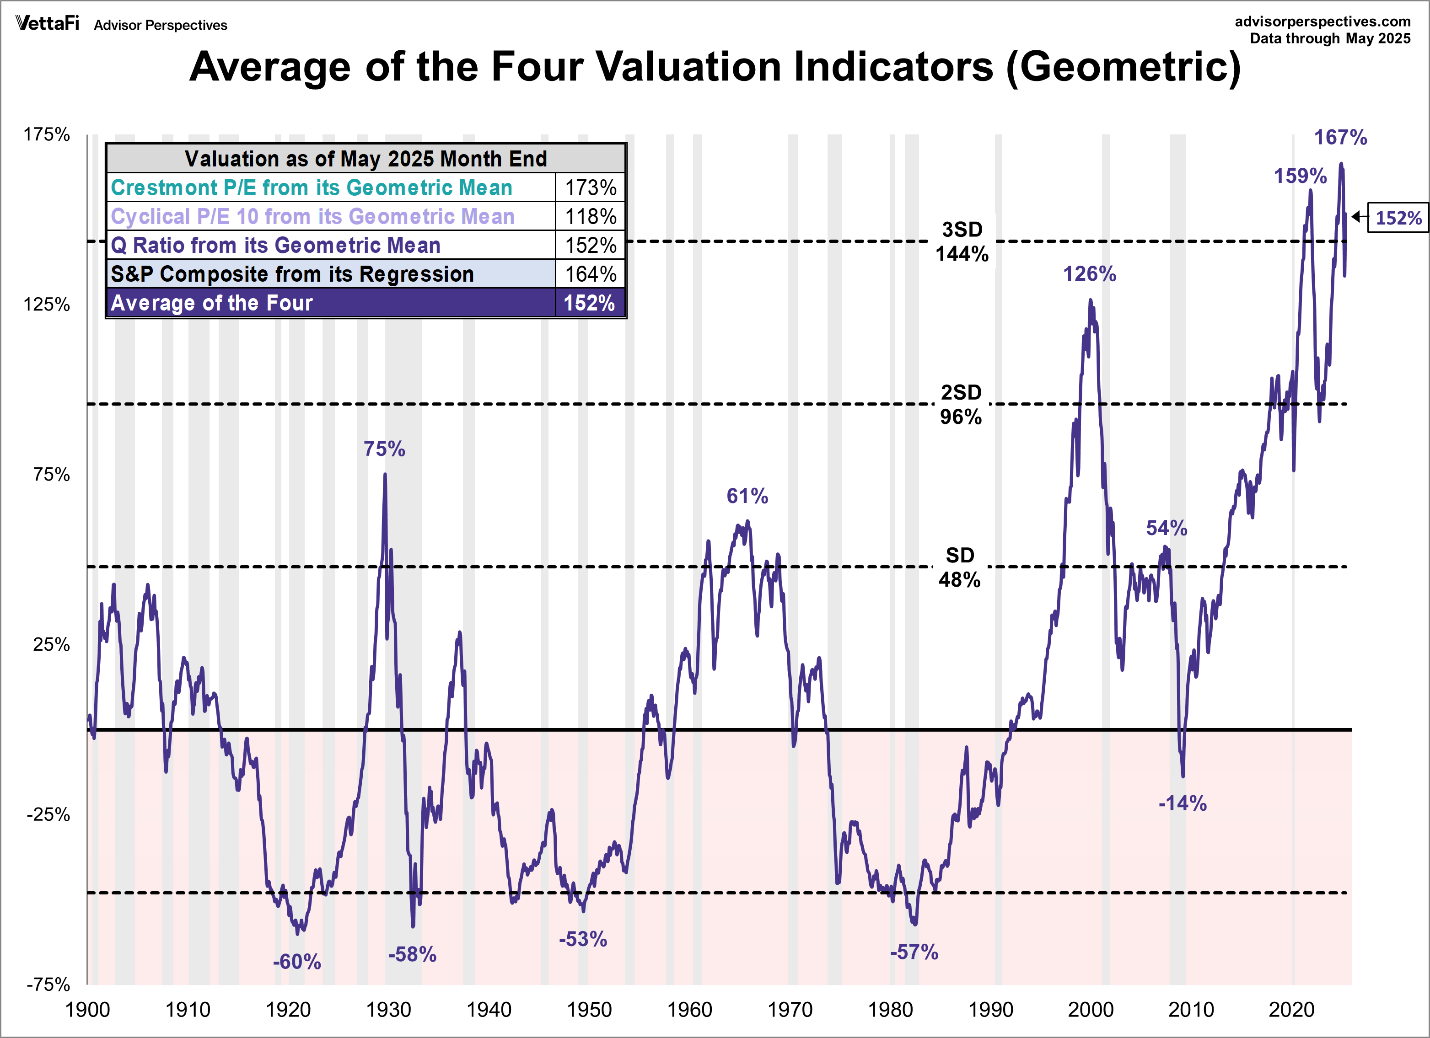
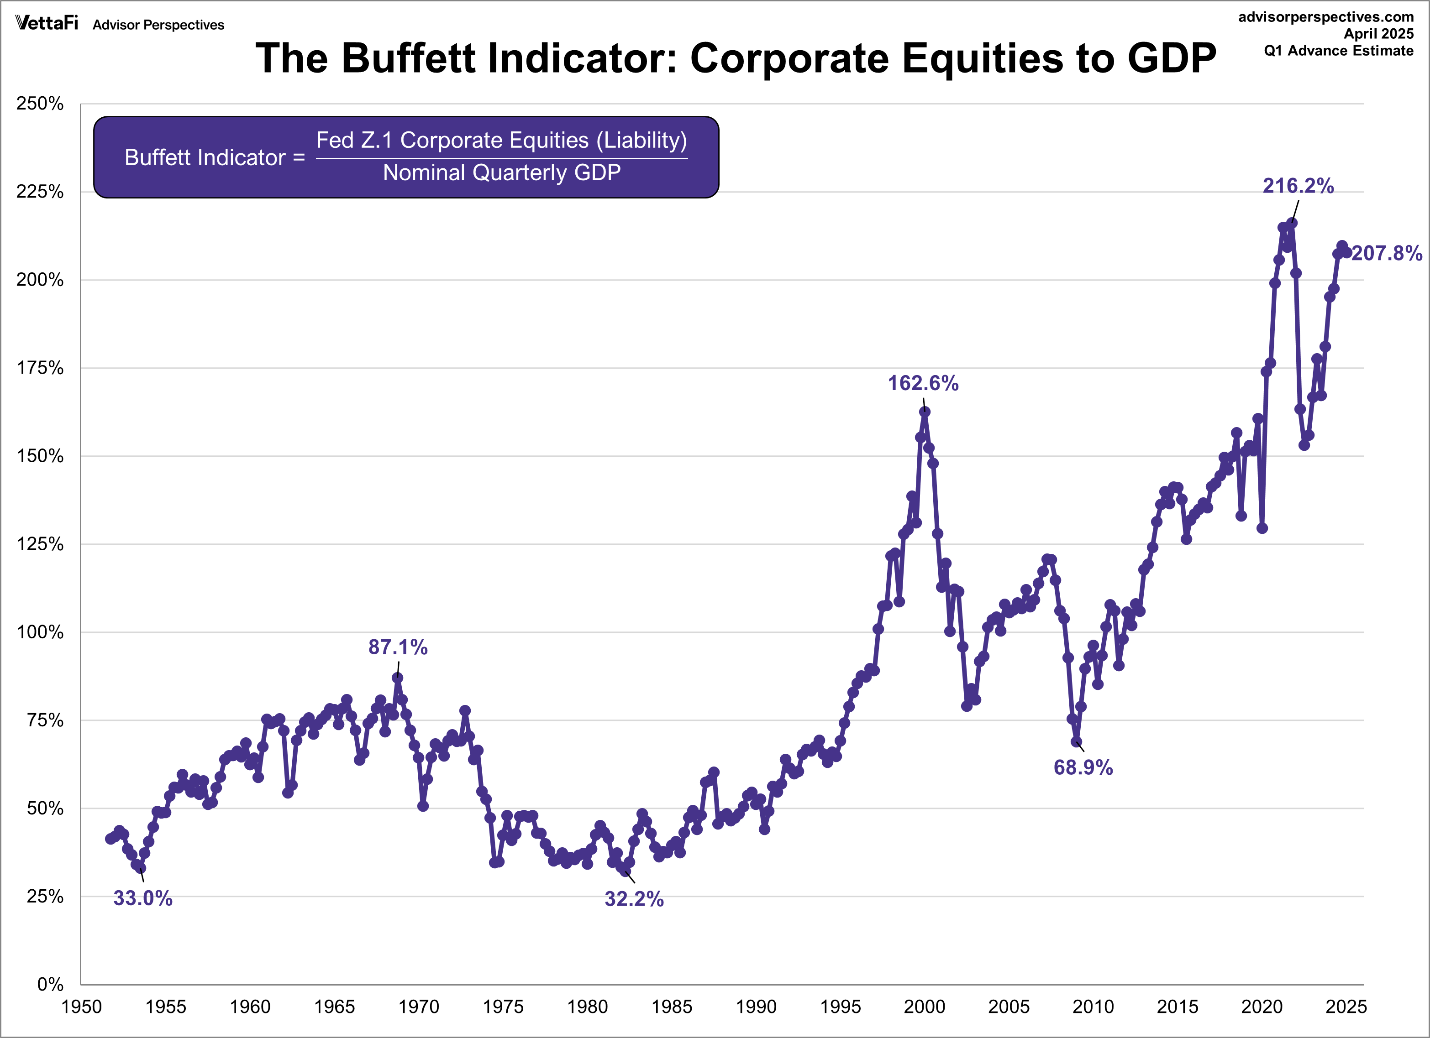
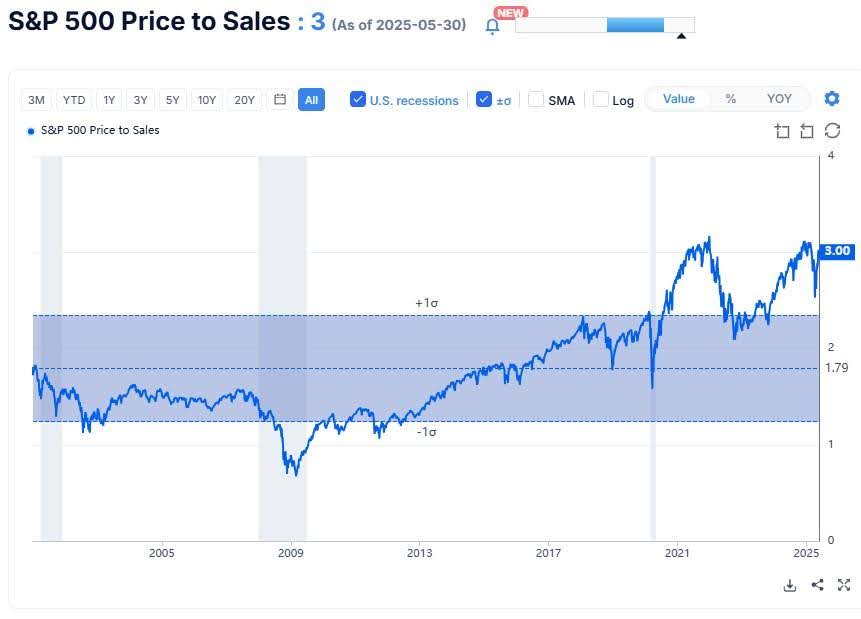
In this missive I share five charts of various valuation methodologies for the current stock market. The first is an average of four different measures, which shows valuations over three standard deviations from the mean. Warren Buffet’s favorite, thus called the Buffet Indicator, is near all-time highs at 207.8%. All four show valuations near peaks and requiring near 50% drops to get back to long-term averages. Lastly, the Price to Sales ratio is 3.0 vs. 1.58 long-term median. Sales numbers are less likely to be financially manipulated, thus a little more reliable. While I have stated previously valuations are not timing mechanisms, they do indicate long-term possible outcomes through complete market cycles.
For further analysis, continue to read The Details below for more information.
“The only mistake in life is the lesson not learned.”
–Albert Einstein
The Details
In this missive, I will share a number of charts that, no matter how you slice it, all indicate the same thing… the stock market remains at historically extreme valuations. And it is important to remember that valuations are not good indicators for timing market movements, but they do provide a realistic view of what the end of the cycle will likely entail. Never in the history of the stock market have markets remained at overvalued levels without a subsequent correction. Unfortunately for economist Irving Fisher, he challenged historical precedent when he stated that markets had reached a “permanent plateau,” just before the October 1929 crash.
The first four charts are from Vetta Fi. The following graph illustrates the average of four separate valuation methodologies. This average is illustrated in the chart with standard deviations. The current reading is 152% above the mean and over three standard deviations from the mean. This shows that to return to the long-term average, the market would have to fall about 60%. Any drop below the mean, such as occurred in the decade prior to 1920, the decades after 1930 until about 1960, and the decade prior to 1980, would require a drop of over 60%.
Next up is the Buffett Indicator, named so because Warren Buffett stated it was his favorite valuation methodology. The methodology divides the price of the market by nominal GDP. Again, it is evident that the current reading is near all-time highs.
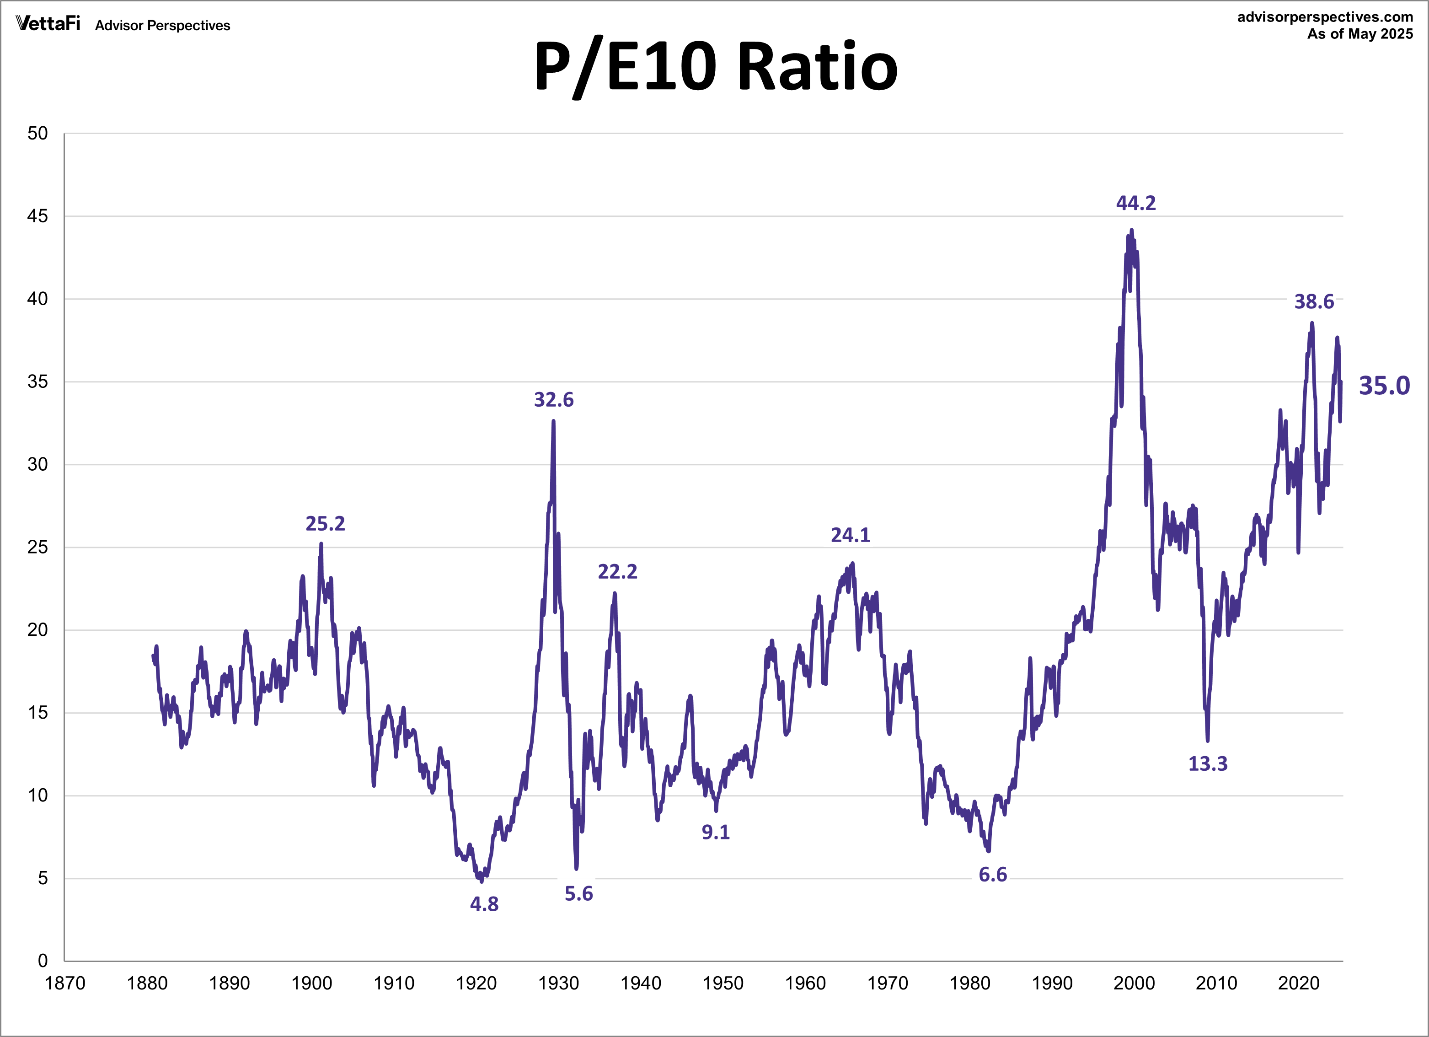
I frequently discuss the Shiller P/E, named after Professor Robert Shiller, also called the P/E10 because it divides the market price of the S&P 500 by the 10-year inflation-adjusted average of earnings. At 35 in the graph (36 as of June 2, 2025), the valuation exceeds the 1929 peak and is only surpassed by the top of the Technology Bubble in 2000 and briefly as earnings plunged during the pandemic in 2021.
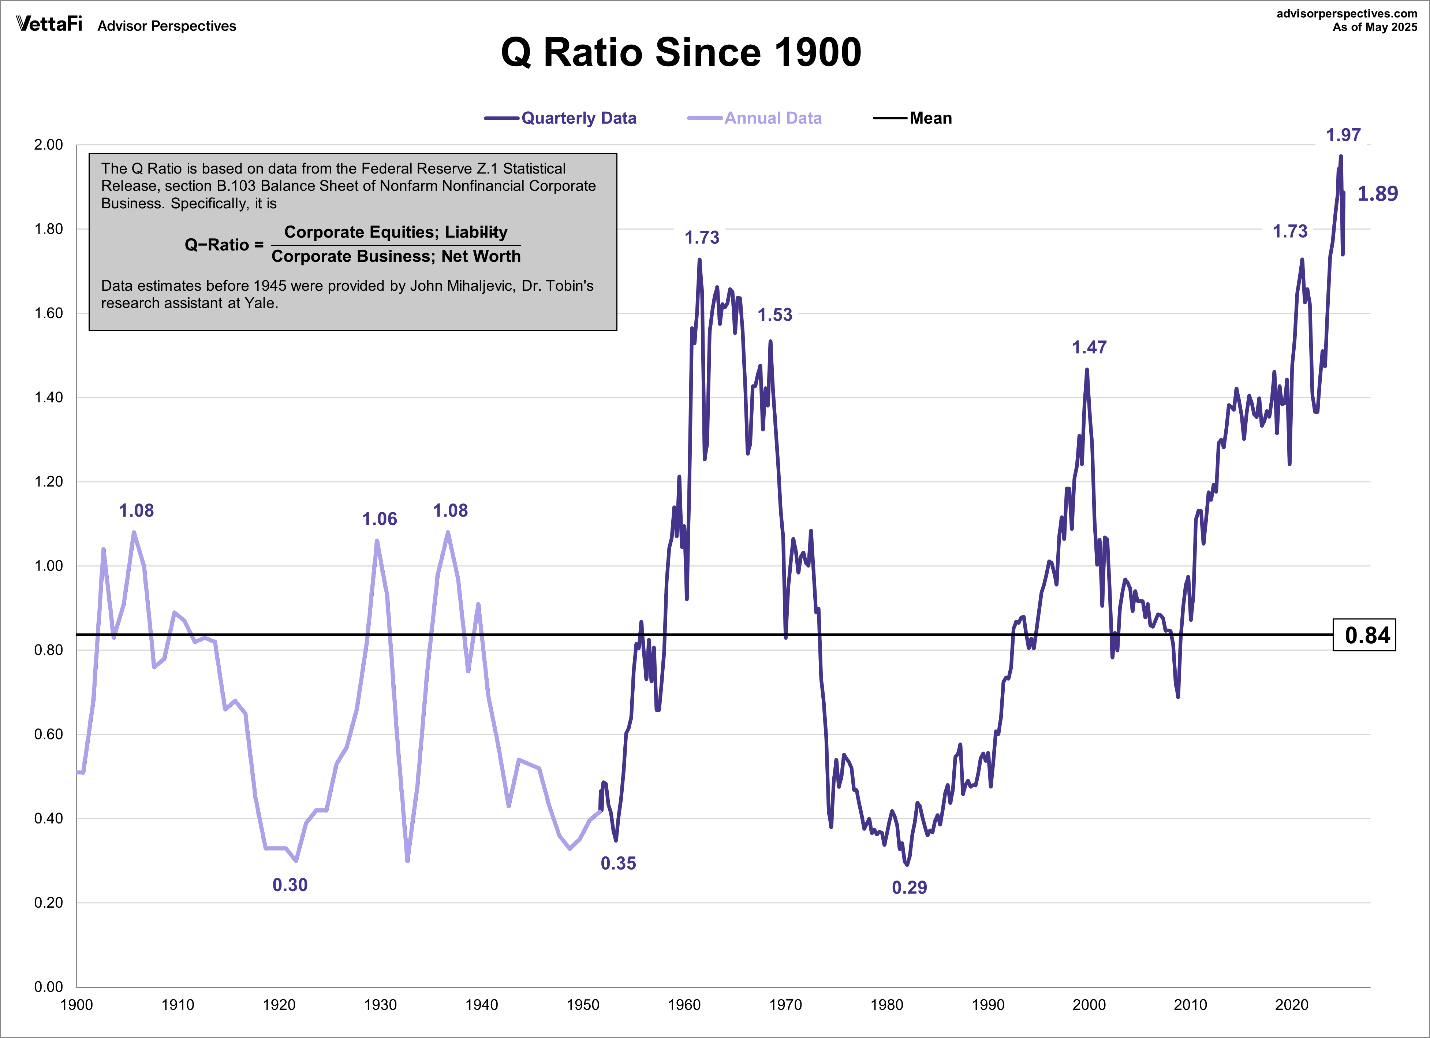
The Q Ratio, shown below, takes a different approach. Sometimes referred to as Tobin’s Q, after economist James Tobin, this ratio divides the price of the S&P 500 by the replacement cost of the companies’ assets. Consistent with the many other methodologies, this indicates a market drop of about 56% is necessary to return to the mean.
And lastly, from Gurufocus.com, one of my favored valuation metrics, the Price-to-Sales ratio. I like this ratio because it is straightforward and does not allow for manipulation of the numbers. Those familiar with financial statements know that there are ways in which earnings can be manipulated. The Price-to-Sales Ratio of the S&P 500 is currently 3.0. The long-term median for this ratio is 1.58 per Multpl.com. Therefore, it would require a drop of at least 47% to hit the median.
As discussed, many times in these newsletters, the stock market has been propped up for over a decade on Federal stimulus and the artificially low interest rates of the recent past. Investors seem to have the mindset of Irving Fisher. Unfortunately, many will also have the same outcome.
The S&P 500 Index closed at 5,912, up 1.9% for the week. The yield on the 10-year Treasury Note fell to 4.42%. Oil prices decreased to $61 per barrel, and the national average price of gasoline according to AAA dropped to $3.14 per gallon.
© 2024. This material was prepared by Bob Cremerius, CPA/PFS, of Prudent Financial, and does not necessarily represent the views of other presenting parties, nor their affiliates. This information should not be construed as investment, tax or legal advice. Past performance is not indicative of future performance. An index is unmanaged and one cannot invest directly in an index. Actual results, performance or achievements may differ materially from those expressed or implied. All information is believed to be from reliable sources; however we make no representation as to its completeness or accuracy.
Securities offered through Registered Representatives of Cambridge Investment Research, Inc., a broker/dealer, member FINRA/SIPC. Advisory services offered through Cambridge Investment Research Advisors, Inc., a Registered Investment Advisor. Prudent Financial and Cambridge are not affiliated.
The information in this email is confidential and is intended solely for the addressee. If you are not the intended addressee and have received this message in error, please reply to the sender to inform them of this fact.
We cannot accept trade orders through email. Important letters, email or fax messages should be confirmed by calling (901) 820-4406. This email service may not be monitored every day, or after normal business hours.

