Executive Summary
Speculators have driven the stock market to extreme highs, along with the imbedded risks. The four graphs (included below) represent various valuation methodologies.
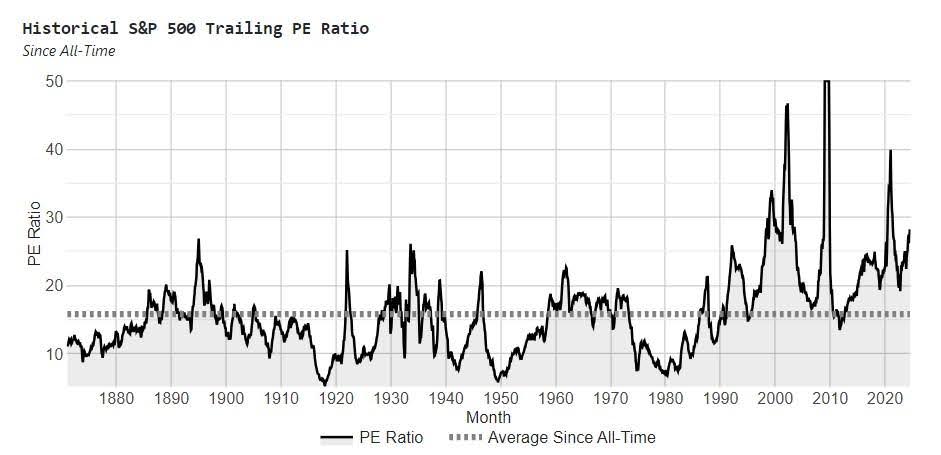
- Twelve-month trailing p/e (currently 30, long-term median is 15)
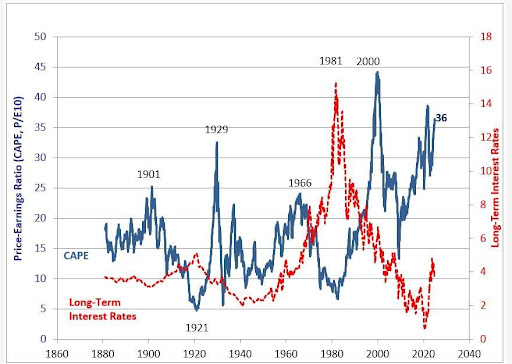
- Shiller P/E (currently 37, long-term median 16)
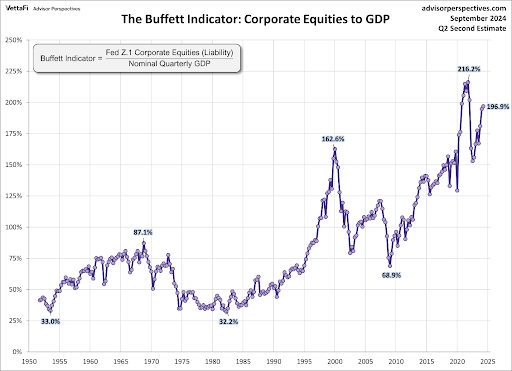
- The Buffet Indicator
- Hussman’s ratio of Nonfinancial Market Capitalization/Nonfinancial corporate gross-value added including estimated foreign revenues (a derivation of Price-to-Sales)
Valuations do not predict how long speculators will continue the advance; however, they do provide a picture of subsequent long-term returns. This is not a prediction, but rather a depiction of the status of markets today versus across history.
Please proceed to read The Details below for more information.
“Good judgment comes from experience, and a lot of that comes from bad judgment.”
–Will Rogers
The Details
In today’s missive, I will share a number of graphs illustrating different stock market valuation methodologies. You will see, no matter how you slice it, the market is near all-time extremes.
One of the oldest methods of determining value is the price-to earnings ratio or the p/e. Using twelve-month historical earnings, the S&P 500 p/e ratio is currently 30! Notice in the graph below that, for the most part, valuations have exceeded the long-term average since about 1990. Much of that has to do with an overactive Federal Reserve attempting to “control” the economy. Under this methodology, the market has only been more overvalued during the Technology Bubble, Financial Crisis and briefly around the Pandemic. The long-term median p/e is 15, or half the current reading.
Economist Robert Shiller of Yale University has modified the p/e, using data from Benjamin Graham and David Dodd, to develop the Shiller P/E, also known as the PE10 or CAPE (Cyclically Adjusted P/E). The Shiller P/E has risen to 37 and has a long-term median of 16. Outside a brief period during the Pandemic, the Shiller P/E has only been higher one time – during the Technology Bubble.
Warren Buffett’s favorite valuation indicator, now nicknamed the Buffett Ratio, compares market capitalization to Gross Domestic Product (GDP). The graph below shows the current Buffett Ratio has only been surpassed once, during the Pandemic when the economy stopped.
As shown in last week’s newsletter, economist Dr. John Hussman’s favorite valuation methodology, and the one most correlated with subsequent actual 10-12 year actual returns, shown below, is at all-time highs.
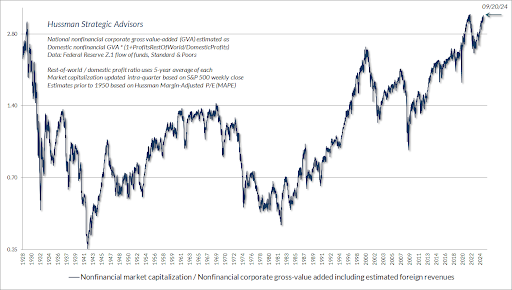
When illustrating all historical outcomes from this valuation method and comparing it to subsequent actual returns, the current reading suggests that the next 12-year average return for the S&P 500 could be around -3.46% per year.
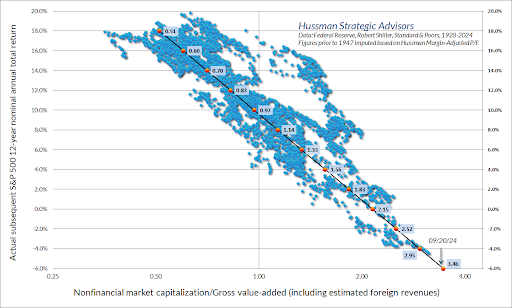
The important thing to note is that all of the above calculations indicate it would take a drop in the S&P 500 of at least 50-65% just to return to long-term average valuations. To reach undervaluation levels – not seen since the 1970’s and early 1980’s – the market would have to fall even further.
Again, any way you slice it, this market is dangerously overvalued. No one knows how long speculators will keep prices elevated, but when the tide shifts, it could occur quickly. Those not prepared could be swept out to sea.
The S&P 500 Index closed at 5,751, up 0.2% for the week. The yield on the 10-year Treasury Note rose to 3.98%. Oil prices rose to $74 per barrel, and the national average price of gasoline according to AAA fell to $3.17 per gallon.
© 2024. This material was prepared by Bob Cremerius, CPA/PFS, of Prudent Financial, and does not necessarily represent the views of other presenting parties, nor their affiliates. This information should not be construed as investment, tax or legal advice. Past performance is not indicative of future performance. An index is unmanaged and one cannot invest directly in an index. Actual results, performance or achievements may differ materially from those expressed or implied. All information is believed to be from reliable sources; however we make no representation as to its completeness or accuracy.
Securities offered through Registered Representatives of Cambridge Investment Research, Inc., a broker/dealer, member FINRA/SIPC. Advisory services offered through Cambridge Investment Research Advisors, Inc., a Registered Investment Advisor. Prudent Financial and Cambridge are not affiliated.
The information in this email is confidential and is intended solely for the addressee. If you are not the intended addressee and have received this message in error, please reply to the sender to inform them of this fact.
We cannot accept trade orders through email. Important letters, email or fax messages should be confirmed by calling (901) 820-4406. This email service may not be monitored every day, or after normal business hours.

