Executive Summary
The week has started with broader markets moving higher. Although, the underlying data is moving in the opposite direction. In an effort to share research from others and not just my thoughts, I have included data from Sven Henrich of Northman Trader, Crescat Capital, as well as economist John Hussman. Also, the Chicago Fed National Activity Index fell further into below average growth territory, and the Dallas Fed Manufacturing Survey showed declining activity. Hussman indicates market conditions are similar to specific instances which closely preceded market plunges – such as March of 2000 and October 2007. All this means speculation is creating significant downside risk. Please proceed to The Details for the research.
“The stock investor is neither right or wrong because others agreed or disagreed with him; he is right because his facts and analysis are right.”
— Benjamin Graham
The Details
With flat to slightly down stock markets last week, the resumption of multiple expansion on weak underlying data continues this morning, Monday, November 25. In last week’s Update, I highlighted the transition of investors into speculators as the disconnect between earnings and stock prices has grown. Today, I will outline a number of specific divergences which enhance the current classification as speculators, and I will provide an update on certain economic information.
A tweet this morning by Sven Henrich of Northman Trader provided a wonderful and alarming data set:
• Market cap [S&P 500] to GDP: 147.5%
• Market price [S&P 500] to sales: 2.2
• Debt [Federal] to GDP: 110%
• Corporate debt: $10 trillion
• US debt [Federal]: $23 trillion
• Consumer debt: $14 trillion
• Earnings growth: Zero
• Q4 GDP growth: 0.5%
And, additional data points selected from a recent article by Crescat Capital via Zero Hedge:
• Highest ever global debt to GDP levels;
• China’s banking assets are valued at USD 41 trillion, including substantial hidden non-performing loans in our analysis, a major mismatch compared to its much smaller and stumbling 13.6 trillion GDP economy;
• Record $17 trillion of negative yielding sovereign debt which may have just peaked in August 2019;
• Private equity/VC excesses in opaque assets, highly leveraged companies, and frequently unprofitable businesses masquerading as new economy disruptors;
• Record indebtedness of US public and private corporations combined relative to GDP;
• Tech bubble 2.0 with extraordinary valuations in SaaS, certain FANG+ stocks, many recent IPOs.Catalysts
The unwinding of these imbalances is likely to be highly destructive to the investment portfolios of unprepared global savers today. Below, we list the confluence of macroeconomic timing signals, including social and geopolitical forces, now bearing down for an assault on overvalued financial assets. Most of these have been uncanny warning signs directly ahead of past bear markets and business cycle peaks.• The Treasury yield curve recently exceeded the critical 70% inversion threshold that has preceded each of the last six recessions with no false signals;
• The Conference Board’s consumer expectations survey has diverged strongly to the downside compared to its unsustainably high present situation index;
• Job openings are declining while the lagging and contrarian unemployment rate is at cyclical lows;
• Both the Atlanta and New York Fed’s real-time GDP trackers have been trending steadily down for almost two years and appear to be approaching recessionary levels;
• Corporate earnings of the Russell 3000 already contracted on a year-over-year basis in the last reported quarter;
• US share buybacks are now 30% lower than 2018;
• Increased insider selling of stocks;
• Declining CEO/CFO confidence surveys;
• ISM manufacturing PMI at recessionary levels;
• Bearish deteriorating stock market breadth while indices reach highs;
• Implied volatility for stocks retesting low levels that preceded previous selloffs
• Smart money flow index diverging from the recent run-up in the S&P 500;
• Leveraged loans stumbling;
• Busted/delayed/cancelled IPOs;
• Recent liquidity crisis that spiked interest rates in the overnight US Treasury rehypothecation market;
• Capacity utilization now falling;
• Commercial & industrial loans declining the most since the housing bust;
• Auto loan spreads rising as delinquency rates rise;
• Net exports of services now falling the most since the GFC and tech bust;The two closest analogs to today’s excessive fundamental valuations for US stocks were the 2000 Tech Bubble and the culmination of the Roaring Twenties in 1929. Our work suggests that today’s valuations are even higher than those two periods. The nifty fifty stock mania of 1972 is another comparable period that featured excessive valuations in a popular group of large cap growth stocks that became widely regarded as “blue-chip” buy and hold positions. Institutions and retail investors were taught to cling to these stocks through thick and thin, throwing fundamental analysis and valuation principles out the window. The same idea is the prevalent passive investing dogma of today.
From today’s valuations, a mere cyclical mean reversion in stock market multiples implies a 50+% drawdown in prices. Yet, too many investors remain oblivious to these valuation risks. Many today have further been lulled into believing that central banks have their backs and will keep markets rising. Such bullish sentiment on the heels of recent Fed liquidity injections has emboldened a late cycle speculative push higher in the indices even as the market internals have been noticeably deteriorating. Never mind that the last two Fed easing cycles after tightening cycles coincided with and were confirmations of major bear markets and recessions underway rather than prevention of them.
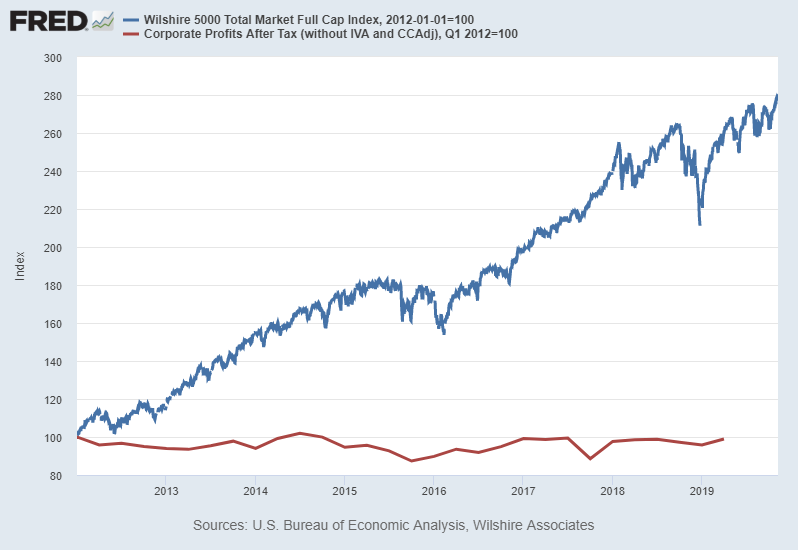
And of course, below is the graphic of the market’s multiple expansion from 2012 forward as shown in prior newsletters:

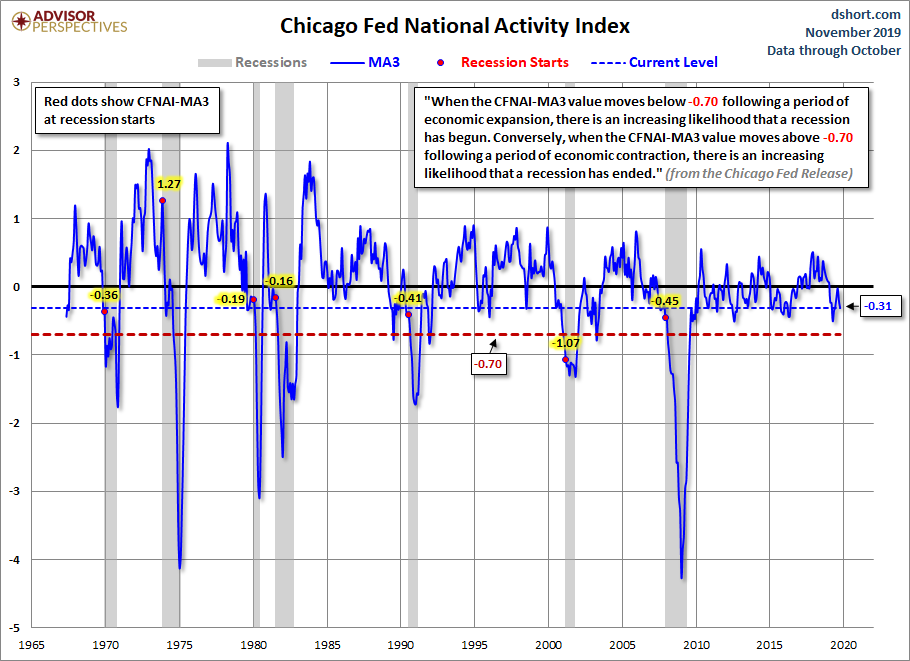
This morning, the Chicago Fed National Activity Index (CFNAI) report, one of the most comprehensive economic summaries, was released. The Index fell to -0.71 from -0.45 in September. According to Advisor Perspectives,
“The Chicago Fed’s National Activity Index (CFNAI) is a monthly indicator designed to gauge overall economic activity and related inflationary pressure. It is a composite of 85 monthly indicators as explained…on the Chicago Fed’s website. The index is constructed so a zero value for the index indicates that the national economy is expanding at its historical trend rate of growth. Negative values indicate below-average growth, and positive values indicate above-average growth.”
The Chicago Fed explains,
“When the CFNAI-MA3 value moves below -0.70 following a period of economic expansion, there is an increasing likelihood that a recession has begun.” See an illustration of the three-month moving average of the CFNAI from Advisor Perspectives below:

The Dallas Fed released its Manufacturing Survey for November with the following results:
• Production fell sharply to -2.4
• Current conditions for capacity utilization plunged
• Current volume of new orders rose, but the growth rate of new orders sunk
• The current outlook for the number of employees fell to a cyclical low
• The outlook for hours worked also plunged
• Current and future conditions for Capex fell sharply
• The forecast and growth rate of new orders declined
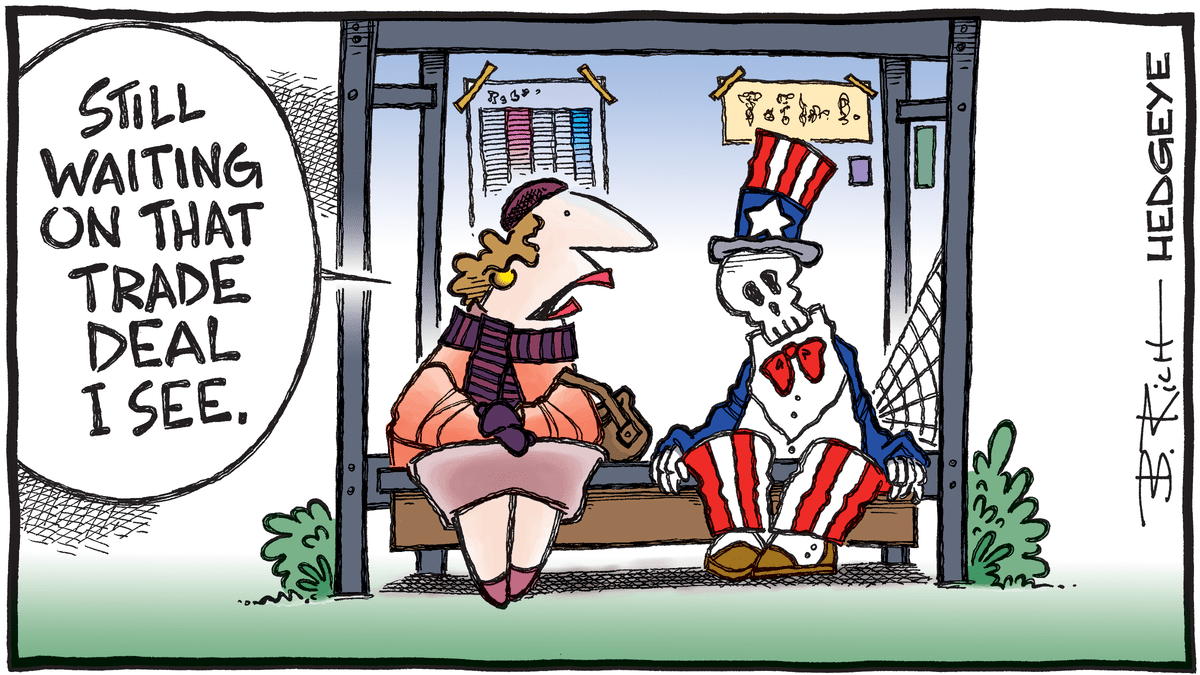
Speculators are ignoring all of the above data and focusing on two things: (1) hope for a Phase One trade deal with China, and (2) the surge in liquidity from the Fed as they purchase $60 billion in T-bills per month. And, the Fed is engaged in secret daily and term repo operations for which they will not disclose which firm(s) are in desperate need of liquidity.

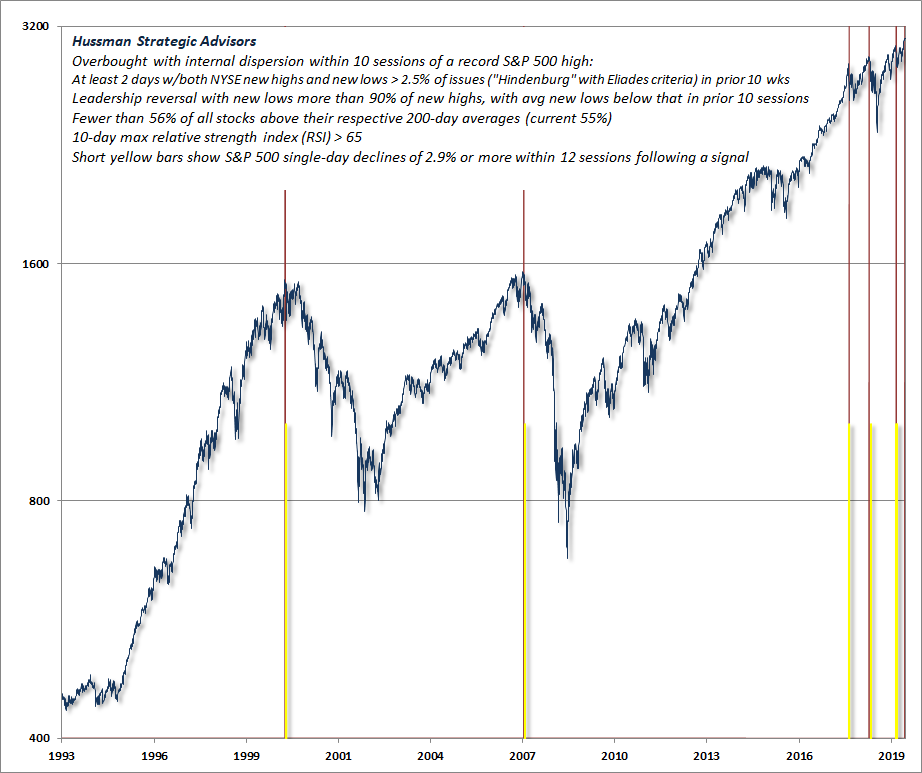
Economist John Hussman provided the following chart indicating conditions are similar to others preceding market plunges. Hussman stated,
“That first red bar in the chart was on March 28, 2000 – two trading sessions after the March 24, 2000 market peak. The second instance was October 19, 2007 – eight trading sessions after the October 9, 2007 market peak. The third instance was February 5, 2018 – six trading sessions after the January 24, 2018 pre-correction peak. The next was September 24, 2018, two sessions after the September 20 market high and immediately followed by a steep market loss into late-December. Finally, we observed similar conditions on August 2 of this year, five sessions after the July 26 interim peak, but followed by only a moderate further correction.
You’ll also notice several short yellow bars next to all of those previous red bars. Those yellow bars indicate single-day S&P 500 declines of 2.9% or more within 12 trading sessions following a given signal. There’s no assurance that we’ll observe that outcome in this particular instance. Still, given the ‘duck-like’ features that I emphasized in the November comment, my sense is that market conditions closely resemble those that we’ve observed at other major market extremes. Given valuations that rival both 2000 and 1929, my impression is that relying on further speculation is playing with fire.”

The data indicates recessionary or near recessionary conditions, flat to falling corporate earnings, record debt levels everywhere, and record stock prices relative to fundamentals. Broad market indexes are completely speculative and subject to tremendous risk of loss when prices reconnect with fundamentals. Speculate carefully!
The S&P 500 Index closed at 3,110 down 0.3% for the week. The yield on the 10-year Treasury fell to 1.77%. Oil prices remained at $58 per barrel, and the national average price of gasoline according to AAA fell to $2.59 per gallon.
© 2019. This material was prepared by Bob Cremerius, CPA/PFS, of Cremerius Wealth Management, and does not necessarily represent the views of other presenting parties, nor their affiliates. This information should not be construed as investment, tax or legal advice. Past performance is not indicative of future performance. An index is unmanaged and one cannot invest directly in an index. Actual results, performance or achievements may differ materially from those expressed or implied. All information is believed to be from reliable sources; however we make no representation as to its completeness or accuracy.
Securities offered through First Heartland Capital, Inc., Member FINRA & SIPC. | Advisory Services offered through First Heartland Consultants, Inc. Cremerius Wealth Management is not affiliated with First Heartland Capital, Inc.
Want to learn more about our Insurance strategies?
Set up a time to chat with us.

