
Executive Summary
In November 2008 the Federal Reserve Bank (Fed) initiated QE1 (The first Quantitative Easing program), the purchase of Treasury Securities with “created” money. They also began moving short-term interest rates zero-bound in an attempt to rescue the struggling economy. After successive QE programs, the result was an increase in the Fed’s balance sheet of about $3.7 trillion and a rising stock market. However, long-term economic growth still only averaged around two percent. In 2015 the Fed began reversing course. After the stock market drop at the end of 2018, the Fed reinstated easy monetary policy by purchasing treasury bills and lowering interest rates this year. Recently, the Fed has had to inject liquidity into the overnight borrowing market – for which little is being disclosed. Are certain banks struggling with liquidity issues? It appears so, but he Fed won’t provide details on their repo operations. Please proceed to The Details for the graphs and more on what may be scaring the Fed.
“History records that the money changers have used every form of abuse, intrigue, deceit, and violent means possible to maintain their control over governments by controlling money and it’s issuance.”
— James Madison
The Details
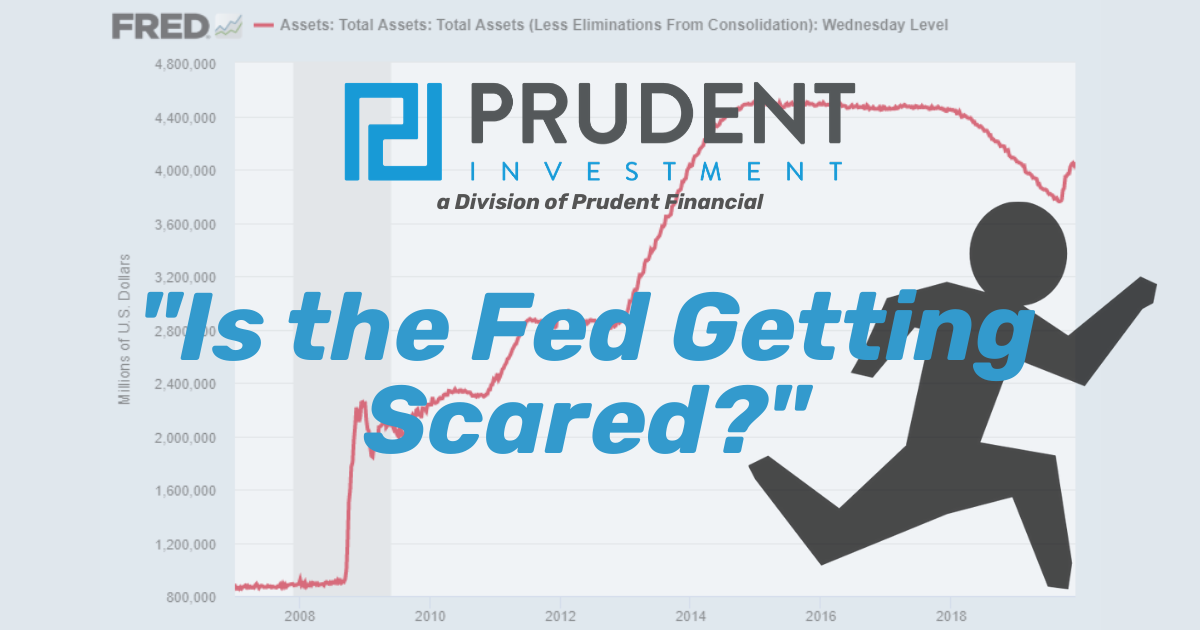
When QE1 was announced in November 2008, nobody realized the path to permanent Fed printing had begun. Through a series of QE (Quantitative Easing) programs, the Fed attempted to rescue the struggling economy by purchasing Treasury Securities with “made-up” electronic funds. This continued until their balance sheet had increased by around $3.7 trillion. The Fed initially ended their QE programs in 2014 as assets on their balance sheet reached $4.5 trillion, from a pre-recession level of under $900 billion. Keep in mind this was in addition to lowering short-term interest rates to close to zero percent.

Where previously the Fed had been reinvesting the proceeds of maturing bonds into new bonds, 2015 saw the Fed allow maturing bonds to “drop-off” of the balance sheet by not reinvesting the proceeds. Additionally, in December 2015 the Fed began gradually increasing short-term interest rates. By the end of 2018 the balance sheet had fallen by a mere 17%, and interest rates increased by only 2.25% and the stock market plunged. Fearful of a deeper bear market, early in 2019 the Fed reversed its posture. So far this year they have cut short-term interest rates three times (0.25% each) for a total cut of 0.75%.
Just to reflect, over the decade since the Great Recession, the Fed’s balance sheet at the end of 2018 was still over $4 trillion and short-term interest rates were a mere 2.25%. Additionally, debt – including corporate, government, and individual – had soared to record levels. With all of this liquidity and debt, the economy only managed to eke-out an average of 2% real annual growth. All it took was a brief correction at the end of 2018 to send a chill down the spine of the Fed.
But apparently there is more than the fear of a market dip that is concerning the Fed. As the stock market “set new all-time highs” on falling corporate earnings and disappointing economic growth, the Fed embarked on a new liquidity program. Although they have specifically stated this is not a new QE program, the Fed recently announced they were purchasing $60 billion per month in Treasury bills. Their balance sheet is now re-inflating at the fastest rate ever. On top of this they have initiated daily and term re-purchase operations.
It is supposed to work like this: when banks don’t have enough reserves at the Fed to satisfy regulations, they borrow from other banks in the overnight Fed Funds market. Banks can go to the Discount Window at the Fed for overnight borrowing, but there is a stigma associated with doing so; therefore, that is typically a bank’s last resort. Lately, for no explained reason, the Fed is lending upward of $120 billion in overnight repos in addition to three longer-term repos of approximately $45 billion each.
Presently, no one seems to understand why there is such a need for liquidity from banks when total excess reserves are over $1.3 trillion. It would appear that certain banks are in serious trouble and their potential counterparties recognize this and won’t lend to them; therefore, requiring the Fed to provide liquidity in the repo market. But the Fed won’t disclose which banks are getting the funds, leaving everyone in the dark.

It is amazing how the public can be fooled into believing the economy is strong after examining what the Fed has undertaken. And, how much debt has increased in order to achieve a level of real growth one-third below the long-term trend. What happens when it is determined the U.S. is in a recession? What will the Fed do? With interest rates already cut this year from 2.25% down to 1.5%, there isn’t much room to drop them further. And, if the Fed is already printing $60 billion per month to purchase T-bills, how much more can they print? See the recent surge in the balance sheet in the first chart above.
There is currently a large ball-and-chain of debt dragging on the economy preventing a resurgence to higher levels of growth. Low interest rates have reduced debt service. However, with the accumulation of so much debt, it isn’t interest payments that are of concern, but repayment of principal. There are already some cracks in the debt markets as defaults in a number of categories are rising.
If all you do is listen to financial media, you are not getting this data. Even today (Monday) the economic data was horrendous, as the ISM Manufacturing Survey missed expectations sinking to 48.1 indicating continued contraction. In this survey, new orders and employment contracted further. This is combined with a weakening profit outlook for the fourth quarter.
This data highlights the absurdity of record high stock prices as the level of multiple expansion is beyond ludicrous. Just look at the chart below.

Apparently, the Fed sees this data and more, and is implementing stealth monetary policy in attempts to keep the stock market from correcting. It is the “and more” part that should have many concerned, as it appears there is trouble in the financial system which is not being disclosed. Is the Fed scared?
The S&P 500 Index closed at 3,141 up 1% for the week. The yield on the 10-year Treasury rose slightly to 1.78%. Oil prices fell to $55 per barrel, and the national average price of gasoline according to AAA remained at $2.59 per gallon.
© 2019. This material was prepared by Bob Cremerius, CPA/PFS, of Cremerius Wealth Management, and does not necessarily represent the views of other presenting parties, nor their affiliates. This information should not be construed as investment, tax or legal advice. Past performance is not indicative of future performance. An index is unmanaged and one cannot invest directly in an index. Actual results, performance or achievements may differ materially from those expressed or implied. All information is believed to be from reliable sources; however we make no representation as to its completeness or accuracy.
Securities offered through First Heartland Capital, Inc., Member FINRA & SIPC. | Advisory Services offered through First Heartland Consultants, Inc. Cremerius Wealth Management is not affiliated with First Heartland Capital, Inc.
Want to learn more about our Insurance strategies?
Set up a time to chat with us.