Executive Summary
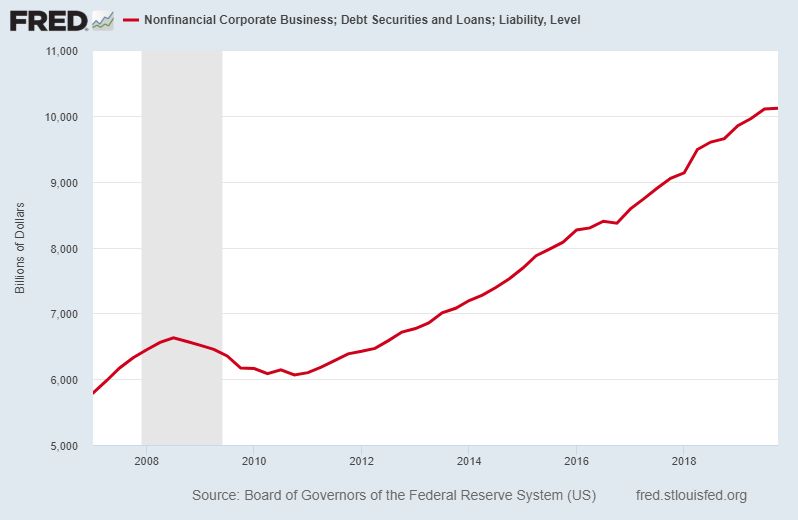
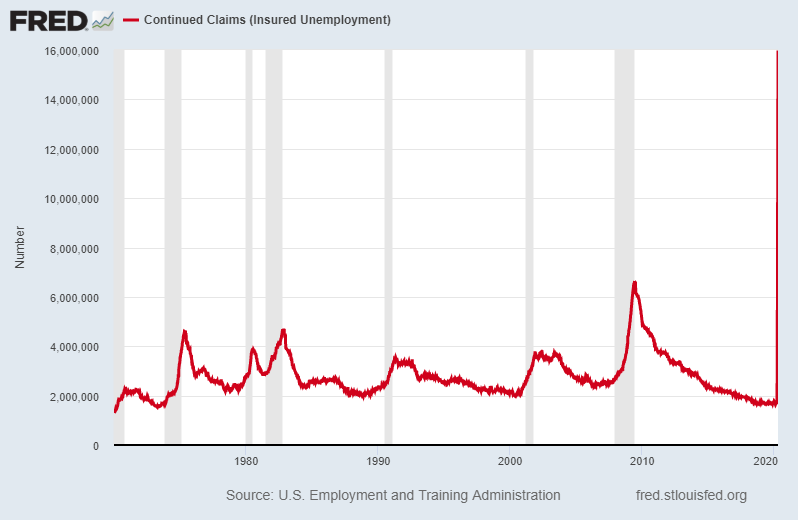
Many investors are probably thinking the recent stock market correction brought stock valuations more in-line with their long-term average. Stock valuations are typically measured using some derivation of the price-to-earnings ratio. The trailing twelve-month price-to-earnings ratio was 24 in February. However, due to the COVID-19 economic shutdowns, earnings are set to drop drastically especially beginning in the second quarter. So while prices have dropped, the greater anticipated drop in earnings (the denominator) will result in stocks being more overvalued than at the prior market peak. Take a look at the continued unemployment claims graph below, as it is startling. It is possible many of these individuals will not resume work after the shutdowns end. This will result in reduced demand for goods and services, making a “V” shaped recovery unlikely. Most individuals were already over-indebted prior to the shutdowns. Now is the time for caution. Please proceed to ‘The Details’ for more information.
“The fact that an opinion has been widely held is no evidence whatever that it is not utterly absurd..”
— Bertrand Russell
The Details
When attempting to assign a valuation to individual stocks or groupings of stocks (Indices), some derivation of the price-to-earnings (P/E) ratio is typically used. The reason is stock prices should represent the present value of a long-term stream of earnings. Therefore, a reasonable multiple of earnings is used to calculate the “value” of a stock. It is amazing what investors can conceive to justify overvalued prices. It is important to understand valuation levels are not good short-term indicators of stock market movements. However, over the long run prices tend to revert to the mean or average valuation. Stated differently, most if not all gains achieved in an overvalued market will eventually be lost when the market corrects.
In early February when the S&P 500 Index peaked just under 3,400, the trailing twelve-month price-to-earnings ratio was about 24 based upon 2019 earnings per share (EPS) of around $139. For reference, the long-term median trailing twelve-month S&P 500 P/E is about 15. The S&P 500 Index is currently about 15% below the February peak. Most investors would read that and assume the P/E had fallen and was much closer to the median. Unfortunately, that assumption would be incorrect. There are two components to the P/E: price & earnings. While the price of the market is about 15% below its peak, earnings are plummeting. Weakness apparent in the pre-COVID-19 economy was only accelerated by the coronavirus shutdowns. Most businesses are seeing revenues plunge with no certainty as to when or if they will return to the pre-COVID-19 weakened state.


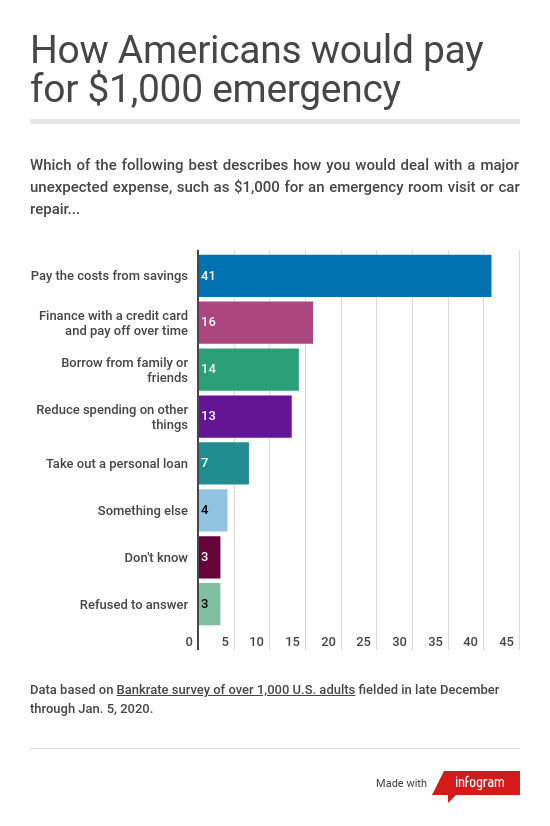
The following graph shows just how ill-prepared Americans were for an unexpected emergency expenditure before the start of the pandemic. This situation is only worsened in our current scenario.

Most likely, S&P 500 EPS will plunge over 50%. However, let’s be optimistic and assume EPS only fall 30% from 2019 levels resulting in EPS of $97. At Monday’s market level that would result in a P/E ratio of 30 or 25% higher than the February peak market valuation. The current bear market rally has been based upon “hope” that the end of quarantines will return economic activity to pre-virus levels and “hope” the trillions of dollars in Fed liquidity will somehow “save” struggling companies. However, saving them and achieving a level of profitability to justify current market levels are two different things. The “Price” in the P/E has soared in recent weeks at the same time expected “Earnings” have fallen off a cliff. In fact, it is so bad corporations have stopped providing forward guidance because they either do not know how bad it will get or they don’t want investors to find out.
The S&P 500 Index is riskier today than at the start of the year. Companies in the index are now reporting first quarter earnings. According to Hedgeye Risk Management, LLC, with 123 companies reporting, earnings are down about 18%. But remember, the first quarter was only affected briefly by COVID-19 quarantines. It is in the second quarter where the real damage will be seen. This week a handful of the largest companies are reporting earnings. The way Wall Street plays the earnings release game is they drop “estimates” to extremely low levels. Thus, when companies report dismal earnings, they can say they “beat estimates.” Beating estimates with no forward guidance as to the carnage that is coming could widen the disconnect producing even more overvalued stock prices.
If investors were thinking valuations had become more reasonable because stock prices are down 15% from the highs and media pundits are touting the coming “V” recovery, they might be disappointed once actual earnings are released especially over the next few quarters. Markets are more overvalued now than they were at the peak.
© 2020. This material was prepared by Bob Cremerius, CPA/PFS, of Cremerius Wealth Management, and does not necessarily represent the views of other presenting parties, nor their affiliates. This information should not be construed as investment, tax or legal advice. Past performance is not indicative of future performance. An index is unmanaged and one cannot invest directly in an index. Actual results, performance or achievements may differ materially from those expressed or implied. All information is believed to be from reliable sources; however we make no representation as to its completeness or accuracy.
Securities offered through First Heartland Capital, Inc., Member FINRA & SIPC. | Advisory Services offered through First Heartland Consultants, Inc. Cremerius Wealth Management is not affiliated with First Heartland Capital, Inc.
Want to learn more about our Insurance strategies?
Set up a time to chat with us.

