Executive Summary
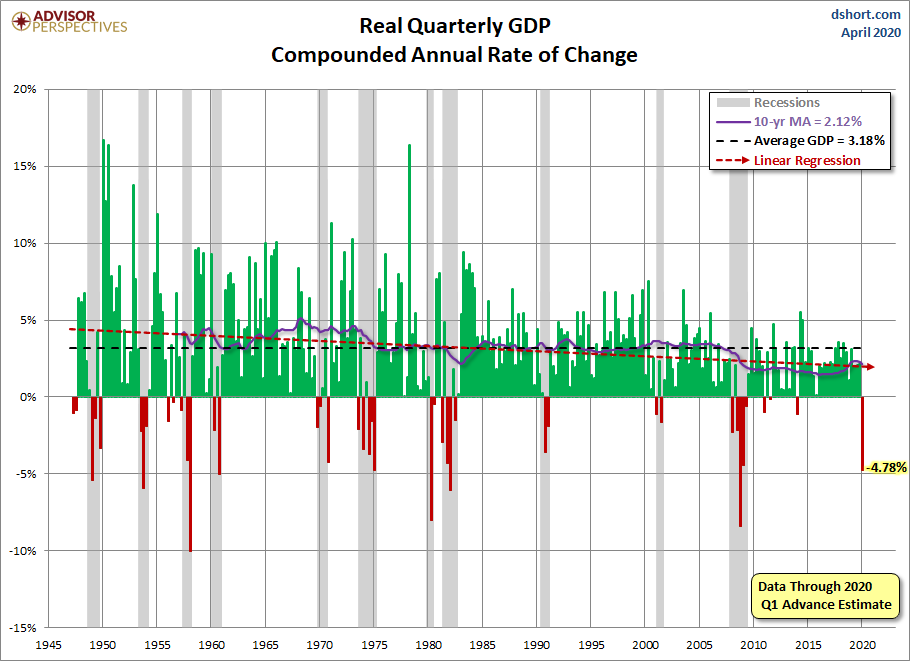
Recent speculation on the shape of the economic recovery has been described as a “V”, a “U” or even an “L”. Since the drop in the stock market in March was drastic and fast, and followed by a strong bear market rally, economic speculation is being confused with a potential sharp move in the stock market, creating a “V” shape. However, the stock market rally is not synonymous with economic recovery. Economic studies have shown once the ratio of Federal debt-to-GDP exceeds 90% for five consecutive years, long-term trend GDP growth is reduced by one-third (See the first graph below). Thus, before the pandemic, long-term economic growth was already being dragged down by debt. According to the Congressional Budget Office estimate, the annual Federal deficit for 2020 could be $3.7 trillion, adding significantly to total debt. The Federal debt-to-GDP ratio could soar to over 135%. Additionally, over 30 million people have recently filed for unemployment, which will have a negative impact on consumption which is the main driver of the economy.
Please proceed to “The Details” for more on the state of the economy pre-COVID-19, and the possibility of a “V” shaped recovery.
“All this talk about ‘green shoots’ is out of control. It’s become the go-to-oh-aren’t-I-clever analogy for signs of economic recovery. It’s obnoxious. It’s factually inaccurate. And it must be stopped!”
— Cindy Perman, “Enough with the ‘GreenShoots!’ Time for a New Term” CNBC, May 6, 2009
The Details
One thing business entertainment media and many financial pundits love is a good “catchphrase.” Anyone remember the leading phrase from 2009 via CNBC? Answer: Green Shoots! At the time, any slight improvement in economic data was declared a “green shoot” or sign of new growth. The current phrase du jour used in anticipation of a quick economic recovery is called a “V” shaped recovery. Of course, not everyone is on the same page; therefore, they also have the “U” and “L” shaped recoveries. What do these letters stand for? The reference is to the direction of economic growth. Unfortunately, thanks in part to certain politicians (this is not a political statement), many have been hoodwinked into believing the economy is the same as the stock market. The mistaken assumption is that if the stock market is strong, the economy must be strong. In reality, the stock market often becomes disconnected from the economy as the cycle progresses. Over the past decade, the stock market was disconnected more often than connected to the underlying economic fundamentals.
The always optimistic financial media were quick to jump on the “V” bandwagon. The “V” of course represents a quick plunge in economic activity due to COVID-19, followed by a strong bounce back to pre-coronavirus growth once businesses resume operations. In theory, a “V” sounds pretty good considering the current circumstances. But how likely is it to transpire? To answer that question, a look at the pre-COVID-19 economic environment is necessary.

In 2009, the annual Federal deficit broke the $1 trillion mark hitting $1.4 trillion. During the post-Financial Crisis “recovery” the deficit dropped to a still large $442 billion in 2015, before doing an about face and heading back toward the $1 trillion level. The estimate for 2020 is for a whopping $3.7 trillion deficit according to the Congressional Budget Office.
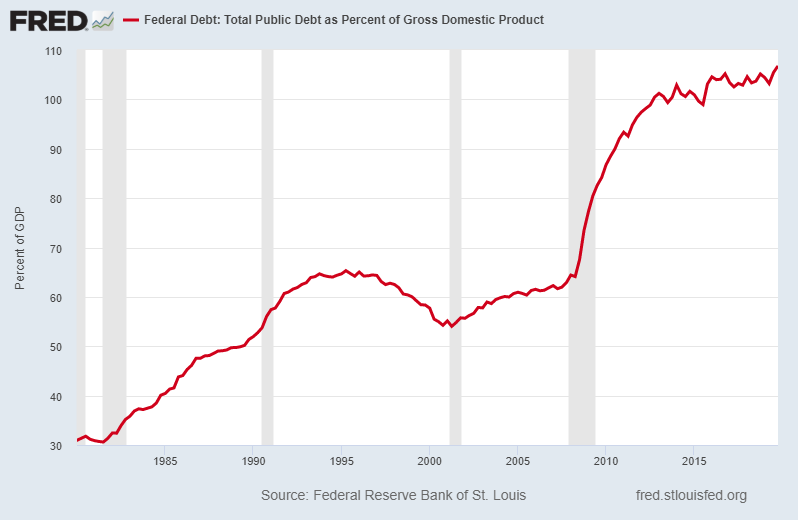
Notice in the chart below, the Federal debt-to-GDP ratio crossed the 90% threshold in 2010 and never looked back. Currently, the ratio is close to 110%; however, based upon projected borrowing (numerator) combined with a drop in GDP (denominator), this ratio could soar to over 135%. Growth had already slowed by about one-third of the previous long-term trend, due to the Federal debt-to-GDP ratio exceeding 90% prior to the pandemic. There are no studies that I am aware of which would indicate the seepage in growth at debt levels of 135% of GDP. Hopefully, this analysis is shedding some light on the true state of the economy pre-COVID-19.

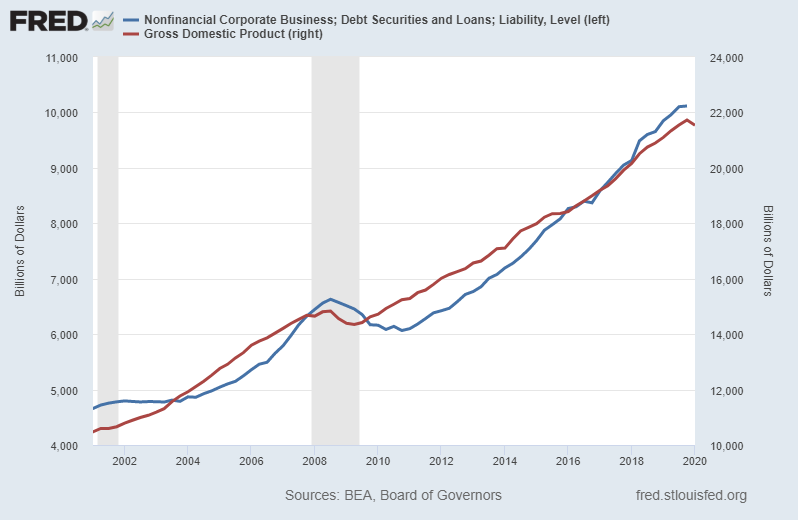
In addition to Federal debt skyrocketing, corporate debt relative to the economy is higher today than at the peak of the Financial Crisis. Prior to the start of the pandemic, the number of “zombie” companies surviving only with the help of massive debt had begun to soar. Currently, the impact of the quarantines and shutdowns will lead to skyrocketing corporate defaults. Corporate profitability had already begun to turn downward before the present crisis. It is now merely accelerated and exaggerated by the extent of the pandemic and its global nature.

Over the past couple of months over 30 million individuals have filed unemployment claims. While for some this is a temporary furlough, it is likely that many will not return to their prior jobs. Weakening demand could also put downward pressure on wages. Being the U.S. is a debt-financed consumption economy, lost jobs and reduced wages will also add to debt defaults. In last week’s newsletter, I pointed out in a chart the difficulty many would have producing the funds for a $1,000 unexpected emergency.
Economist Dr. Lacy Hunt of Hoisington Investment Management recently wrote in his quarterly newsletter, “By early next year, total private and public debt could reach a new all-time peak of approximately 405% of GDP, compared with the 402% at the time of the Lehman failure [2008].” Summarizing another of Dr. Hunt’s points, in 2019 a dollar of debt generated about $0.40 of GDP growth. Or conversely, it took $2.50 in debt to produce $1 of economic growth. Dr. Hunt expects this ratio to fall to $1 of debt to produce $0.25 of GDP growth (or $4 of debt for $1 of growth).
To proclaim as they do on financial entertainment television that the economy, which could plunge over 10% in 2020, will simply pop back up to pre-COVID-19 levels, as the “V” shape implies, is just not realistic. This over-simplistic phrase ignores the largest obstacle to future economic expansion, and one which was already a significant drag on growth: massive debt. I am not sure what letter of the alphabet the post-coronavirus economy will look like, but I am far from convinced it will be a “V”. And please remember, the stock market is not the economy.
The S&P 500 Index closed at 2,831 down 0.2% for the week. The yield on the 10-year Treasury Note rose to 0.64%. Oil prices increased to $20 per barrel, and the national average price of gasoline according to AAA remained at $1.78 per gallon.
© 2020. This material was prepared by Bob Cremerius, CPA/PFS, of Prudent Financial, and does not necessarily represent the views of other presenting parties, nor their affiliates. This information should not be construed as investment, tax or legal advice. Past performance is not indicative of future performance. An index is unmanaged and one cannot invest directly in an index. Actual results, performance or achievements may differ materially from those expressed or implied. All information is believed to be from reliable sources; however we make no representation as to its completeness or accuracy.
Securities offered through First Heartland Capital, Inc., Member FINRA & SIPC. | Advisory Services offered through First Heartland Consultants, Inc. Prudent Financial is not affiliated with First Heartland Capital, Inc.

