Executive Summary
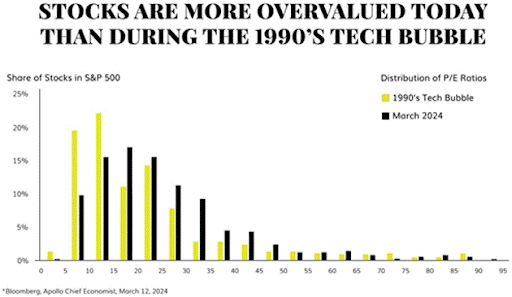
Last week’s issue compared the exuberance in AI stocks (specifically Nvidia) to the Technology Bubble (1990’s-2000) stocks such as Cisco Systems. This week will expand on the broader market (S&P 500) overvaluation for the same time frame. Back in 1999, 43% of stocks were trading 15x earnings or cheaper. Today that number is 25%, meaning more companies are overvalued than in 1999. See the graphs below and explanation of the impact of money supply on stock overvaluation. However, the bottom line is markets are very overstretched, meaning the imbedded risk of more widespread reversion to the mean is present today than in 1999.
Please continue to The Details for more of my analysis.
“Better to have bad news that’s true than good news we made up.”
–Eric Ries
The Details
Last week I compared the recent exuberance in AI (artificial intelligence) stocks to the Technology Bubble, which peaked in 2000. Specifically, I illustrated the performance of AI chip maker Nvidia to that of communications software and hardware manufacturer Cisco Systems. I stated that although the attention today surrounds technology and AI, the bubble has been brewing for a long time thanks to unprecedented monetary and fiscal policy. A point I want to make today is that although the “Magnificent 7” stocks (Amazon, Apple, Facebook (Meta), Google (Alphabet), Microsoft, Nvidia and Tesla) have led the charge higher, for the most part, the other 493 stocks in the S&P 500 have been pulled higher and are also overvalued.
In his recent newsletter, John Mauldin discussed the subject of market overvaluation, drawing a comparison to 1999. He quoted his friend David Bahnsen (who prepared the following graph), as saying, “…the quantity of companies trading above 20x, 25x, 30x, 35x, and 40x earnings is significantly higher than it was in 1999. Then, you at least had 43% of the index trading at 15x or cheaper. Today, that number is just 25%.”
The graph below illustrates that overvalued companies in the S&P 500 Index are more widespread today than during the Technology Bubble.

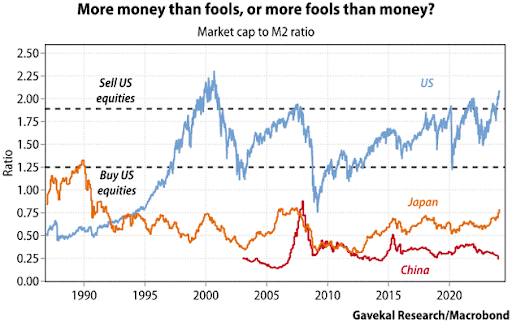
In order to purchase stocks, investors and/or speculators need money. The largest source of such money has always been central banks as described by John Mauldin. John quoted investment professional Louis Gave, of Gavekal, as saying, “I never tire of quoting Beat Notz, who many decades ago told me, ‘it’s an easy business: just figure out if there is more money than fools, in which case asset prices rise, or more fools than money, in which case asset prices struggle.”
Using this philosophy, Louis Gave divides stock market capitalization by M2 broad money. This produced the blue line in the graph below. This is just another methodology confirming the current overvaluation in stocks.

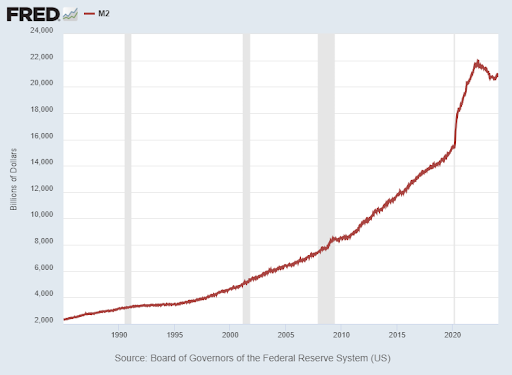
The chart above shows an extremely overvalued market. The denominator in the equation is the broad money supply measured by M2. The graph below shows that M2 is falling. This compounds the problem and indicates the market is more overvalued than observed at first glance.

The purpose of this missive is to add to the wealth of data indicating that markets are very stretched. Not only are they stretched, but overvaluation is more widespread than during the past Technology Bubble. This means that when the reversion to the mean occurs it will likely reinforce the old Wall Street adage that the only thing that goes up in a down market is correlation.
The S&P 500 Index closed at 5,117, down 0.1% for the week. The yield on the 10-year Treasury
Note rose to 4.30%. Oil prices increased to $81 per barrel, and the national average price of gasoline according to AAA rose to $3.46 per gallon.
© 2023. This material was prepared by Bob Cremerius, CPA/PFS, of Prudent Financial, and does not necessarily represent the views of other presenting parties, nor their affiliates. This information should not be construed as investment, tax or legal advice. Past performance is not indicative of future performance. An index is unmanaged and one cannot invest directly in an index. Actual results, performance or achievements may differ materially from those expressed or implied. All information is believed to be from reliable sources; however we make no representation as to its completeness or accuracy.
Securities offered through First Heartland Capital, Inc., Member FINRA & SIPC. | Advisory Services offered through First Heartland Consultants, Inc. Prudent Financial is not affiliated with First Heartland Capital, Inc.

