Executive Summary
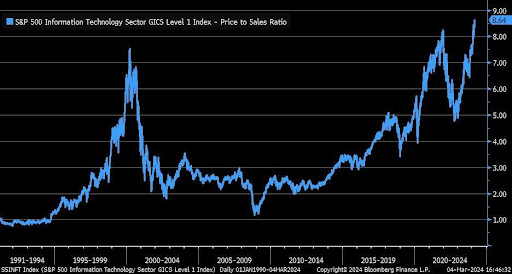
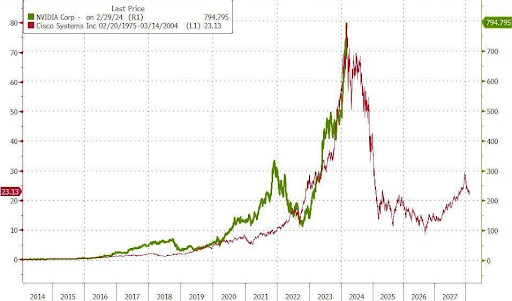
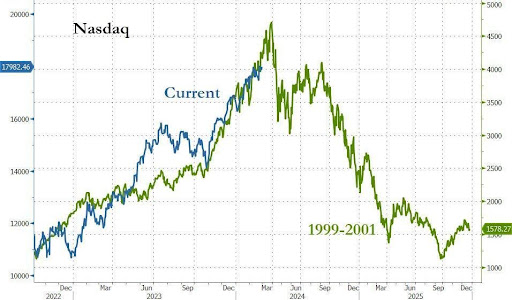
In this issue comparisons will be shown between the Technology, or Dot-Com, Bubble and the current Everything Bubble – extended by the AI boom. The first graph from Charles Schwab & Co.’s chief investment strategist shows the Price-to-Sales ratio for the Technology Bubble through the current bubble. The second graph compares what Cisco Systems did from 1975-2004 (culminating in the Dot-Com bubble) with Nvidia’s current run up as an integral chip producer for AI. The third graph shows the similarities between the Technology Bubble and the current run of the tech heavy Nasdaq. Prior to the most recent craze of AI, the market had been building for a decade from unprecedented government monetary and fiscal policy. Many valuation methodologies (last graph) as well as technical indicators point to a bubble. As they say history may not repeat, but it sure looks like it could rhyme.
Please continue to The Details for more of my analysis.
“Those who cannot remember the past are condemned to repeat it.”
–George Santayana
The Details
The Technology, or Dot-Com, Bubble peaked in March 2000, with the Nasdaq-100 Index subsequently falling over 80% through about March 2009. The bubble was founded on the rapid rise of the internet. Invented in the early 1980’s, its use did not become a household phenomenon until the early 2000’s. In the mid-1990’s less than half of households had access to the internet. As the technology spread and intrigue soared, companies began to see opportunities. Soon, any association with this “new” technology drew investors and speculators alike. Retail stores quickly realized they could add “.com” to their name and raise funds quickly, even if they were not profitable.
Companies sprung up all over developing software and other technologies associated with the internet. The phenomenon was not too different than what is being witnessed today regarding AI (Artificial Intelligence) development and usage. In this newsletter I will briefly compare the Tech Bubble to the current AI boom. During both periods, investors quickly turned into speculators as any semblance of rationality was thrown out of the window. Price-to-earnings ratios reached levels never previously seen. Companies were going public producing billionaire investors for companies with little, if any, revenue. The graph below from Liz Ann Sonders, Chief Investment Strategist for Charles Schwab & Co. shows the absurdity of valuations both then and now. The graph shows the Price-to-Sales ratio for the S&P Technology Sector. The level of overvaluation is greater now than during the Tech Bubble.
The current rise in technology stock prices is led by semiconductor manufacturer Nvidia Corporation, which has ventured into producing AI chips. While Nvidia’s revenue growth has been impressive, often investors push prices too far relative to sustainable revenue growth. During the Technology Bubble, a producer of communications software and hardware, Cisco Systems, Inc., drew similar interest. Cisco went public in 1990 and had a market cap of about $224 million. Soon speculators sent the stock skyrocketing pushing the market cap to $500 Billion by 2000. The dramatic rise and fall are shown in red in the graph below via Zero Hedge. In this graph, the green line represents the price of Nvidia stock. The dates at the bottom correspond to Nvidia’s price movements. It is important to note that the market cap of Cisco Systems today, about $200 billion, remains less than half of its peak level 24 years ago.
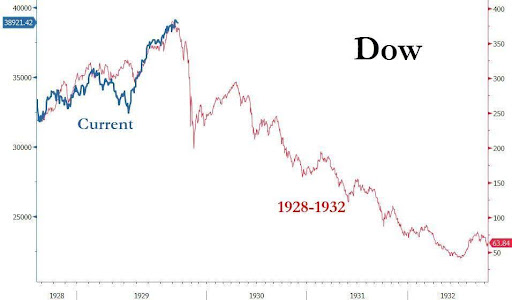
The graphs below, also from Zero Hedge, show a comparison of the Nasdaq Index to the Tech Bubble period, and compares the Dow Jones Industrial Average to the period leading up to and following the Great Depression.
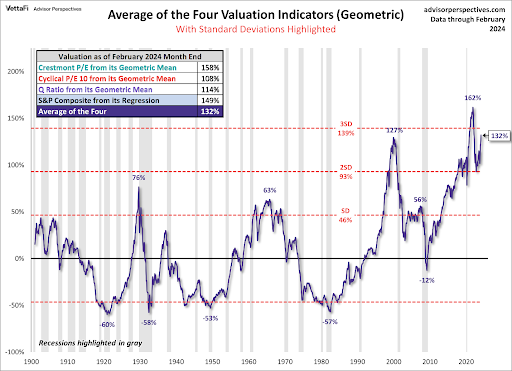
The difference between today’s stock market bubble and prior bubbles is that the current bubble has been building for over a decade due to unprecedented monetary and fiscal policies. The concentration in the AI/technology sector is more of a recent phenomenon. Prior to the recent fascination with AI and surge in technology stocks, the overall market bubble, nicknamed the “Everything Bubble” had already been brewing for quite some time. The graph below from Advisor Perspectives shows the average of four S&P 500 valuation methodologies. The graph illustrates that valuation levels have been over one standard deviation from the mean since around 2013. They are once again precariously close to three standard deviations from the mean – something that only occurs 0.3% of the time. Current valuations suggest a correction of about 57% would be required to return to the mean.
Stock market bubbles are not a new phenomenon. The two greatest prior bubbles were the 1929 peak before the Great Depression, and the 2000 peak during the Technology Bubble. When factoring in the amount of Fed and government intervention used to create the speculative fervor combined with the amount of debt in existence today, one can easily say this is the greatest deviation from fundamentals in history.
Due to both fundamental and technical indicators, it is my opinion that the return to the downward trending bear market, which began in January 2022, will be visible soon. I do think this time will rhyme.
The S&P 500 Index closed at 5,124, down 0.3% for the week. The yield on the 10-year Treasury
Note fell to 4.09%. Oil prices decreased to $78 per barrel, and the national average price of gasoline according to AAA rose to $3.39 per gallon.
© 2023. This material was prepared by Bob Cremerius, CPA/PFS, of Prudent Financial, and does not necessarily represent the views of other presenting parties, nor their affiliates. This information should not be construed as investment, tax or legal advice. Past performance is not indicative of future performance. An index is unmanaged and one cannot invest directly in an index. Actual results, performance or achievements may differ materially from those expressed or implied. All information is believed to be from reliable sources; however we make no representation as to its completeness or accuracy.
Securities offered through First Heartland Capital, Inc., Member FINRA & SIPC. | Advisory Services offered through First Heartland Consultants, Inc. Prudent Financial is not affiliated with First Heartland Capital, Inc.
