Executive Summary
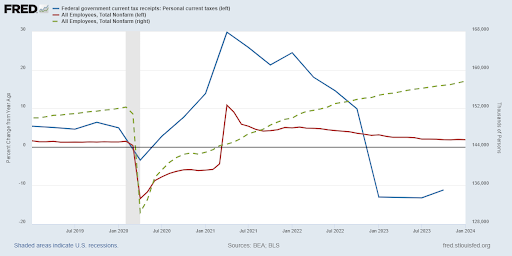
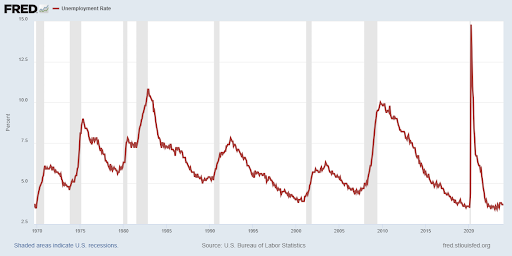
In January 2024 the Unemployment Rate was 3.7%, leading many to believe the economy is strong due to the labor force. However, digging into the data deeper provides puzzling results. The number of employed persons has increased, albeit so have individuals holding multiple jobs, which would lead one to think Federal personal tax receipts would increase. The green dashed line in the first graph shows the increase in the number employed, but the blue line shows the year-over-year percentage of tax receipts falling. The second graph shows employment numbers tend to bottom out just before recessions. With more corporate layoffs forecasted, the numbers may not be revealing the “all clear.”
Please continue to The Details for more of my analysis.
“No two persons ever read the same book.”
–Edmund Wilson
The Details
With the economy slowing, and in the face of numerous large company layoffs, many analysts are puzzled by the strength in the employment numbers. In this missive I will take a brief look at employment numbers and test their validity by examining Federal personal tax receipts. As of January’s employment report, there were 161,152,000 people employed according to the Household Survey. This resulted in an Unemployment Rate of 3.7%. Compared to last year, the number employed increased by 0.6% and the Unemployment Rate rose 0.3%.
Digging a little deeper into the Household Survey, the division of jobs between full-time and part-time employees was little changed. However, the number of multiple job holders increased by almost 400,000 or 5% compared to the prior year. With jobs continuously increasing, despite the huge number of layoffs reported, one should expect a sharp increase in Federal personal tax receipts. In the graph below, the green dashed line shows the increase in the number of employed individuals. The red line shows the percentage increase, compared to last year, in those employed. While the percentage increase in employed workers has come down, it remains above zero for a positive increase.
The blue line in the graph represents the year-over-year percentage change in Federal personal tax receipts. The rate of change peaked at the beginning of 2021 and has increased at a slower pace since. But, more importantly, since about November 2022 the rate of change has been falling, meaning the percentage of Federal personal taxes collected was below that of the prior year. The number of receipts has fallen for over a year now.

As the economy continues to slow and more layoffs occur, the amount of Federal taxes collected will continue to drop. This at the same time the Federal Government continues on a spending spree, with a 2024 deficit estimated to be around $1.6 trillion – which means it will probably end up around $2 trillion. The annual deficit is expected to grow to about $2.6 trillion in 10 years. Again, it would not be surprising to see this estimate rise significantly higher. With higher interest rates, one can see the storm brewing.
The reported unemployment rate is near all-time lows. The number employed continues to rise, albeit with a growing percentage of multiple job holders. Yet, the percentage of Federal personal tax collections are falling year-over-year, while deficits soar. Notice in the graph of the Unemployment Rate below, that the rate tends to bottom-out just before a recession (gray shaded areas). Then, the Unemployment Rate soars as the recession begins.

Now is not the time to become complacent just because the Unemployment Rate is low. The overall macro-economic picture indicates a recession is very likely this year. Also, layoffs are expanding as tax receipts are falling. Sometimes the data is not saying what you originally thought.
The S&P 500 Index closed at 5,137, up 0.9% for the week. The yield on the 10-year Treasury
Note fell to 4.18%. Oil prices increased to $80 per barrel, and the national average price of gasoline according to AAA rose to $3.35 per gallon.
© 2023. This material was prepared by Bob Cremerius, CPA/PFS, of Prudent Financial, and does not necessarily represent the views of other presenting parties, nor their affiliates. This information should not be construed as investment, tax or legal advice. Past performance is not indicative of future performance. An index is unmanaged and one cannot invest directly in an index. Actual results, performance or achievements may differ materially from those expressed or implied. All information is believed to be from reliable sources; however we make no representation as to its completeness or accuracy.
Securities offered through First Heartland Capital, Inc., Member FINRA & SIPC. | Advisory Services offered through First Heartland Consultants, Inc. Prudent Financial is not affiliated with First Heartland Capital, Inc.

