Executive Summary
This week’s edition continues from last week in looking at Federal Government data released. Real GDI (Gross Domestic Income) and real GDP are typically the same except for some minor statistical disparities, as described below by economist Dr. John Hussman. However, looking at the first graph below, one would not draw that conclusion. Then, last week was the blow out “new jobs” number of 353,000 from the Establishment Survey. Not only was this significantly higher than anticipated, but also was quite different from the Household Survey reporting only a 31,000 increase in those employed. Additionally, look below at the list of twenty-one companies announcing layoffs. Something seems puzzling at the very least.
Please continue to The Details for more of my analysis.
“It is a capital mistake to theorize before one has data.”
–Sherlock Holmes
The Details
Continuing with the theme from last week’s newsletter regarding the veracity of data released by the Federal Government, this week I will highlight a couple additional discrepancies worth noting. Since the “soft landing” narrative has replaced an expected recession in much of the mainstream financial media, it might be important to examine some contradictory data. The following statement is from economist Dr. John Hussman,
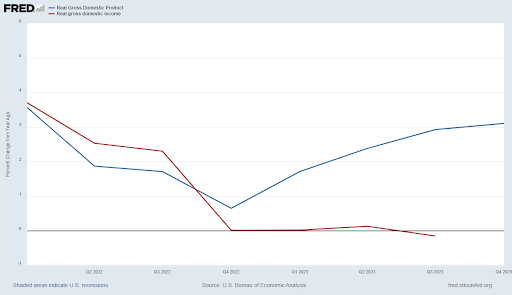
“Two additional disparities are worth monitoring. The chart below shows the year-over-year growth of real Gross Domestic Income versus real Gross Domestic Product. Technically, these measure the same thing, just in different ways, and they’re normally identical aside from a small statistical disparity. In a few cases, however, as when the U.S. was rolling into global financial crisis, GDI fell into contraction well before GDP. Currently, GDI is again in contraction year-over-year, making it difficult to take the robust 4th quarter GDP figures at face value. It may be best to allow the possibility that a ‘soft landing’ may not be as sure as it seems.”
In the graph below, the blue line represents year-over-year change in real Gross Domestic Product versus the change in Gross Domestic Income in red.

Moving on to the perplexing employment situation, the picture is quite fuzzy. The “everything is rosy” picture cherry picks data from two surveys. As I have described in previous missives, the monthly payroll report is derived from two surveys – one of businesses and one of households. The all-important unemployment rate is calculated from the Household Survey, while the much anticipated monthly “new jobs” number is plucked from the Establishment Survey (of businesses). Lately, the monthly data in these surveys has deviated from one another.
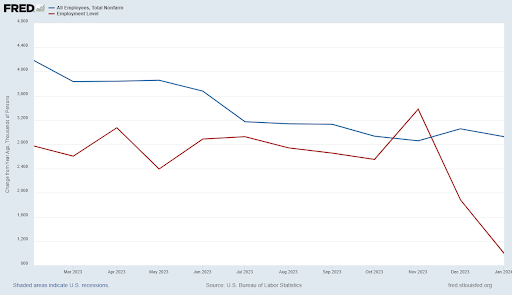
The blue line in the graph below represents the change from a year ago, in thousands of persons, of those employed via the Establishment Survey. Notice the decline in the rate of employment growth over the past year. The Household Survey results are shown in red and highlight a much lower rate of growth in employment.

Last week the media excitedly tried to put the recession theory to bed by extoling the reported outsized jump of 353,000 in “new jobs” (Establishment Survey) in January. However, the Household Survey showed a mere 31,000 increase in those employed. Liz Ann Sonders, Managing Director and Chief Investment Strategist at Charles Schwab underscored the large change from full-time to part-time employment when she stated,
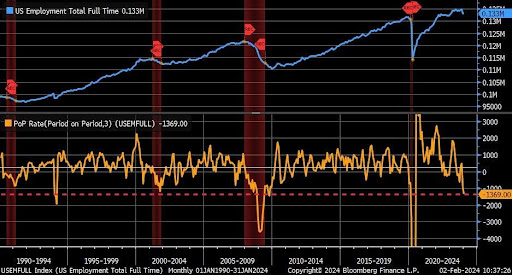
“Yet another oddity in current labor market: full-time employment has plunged by nearly 1.4 million people over past three months … rolling 3m change of that magnitude is rare going back in history.”

The “strong employment” narrative pushed by the unexpected surge in employment per the Establishment Survey flies in the face of the massive layoffs announced recently. According to a recent Tweet by the Kobeissi Letter, the following list shows the extensive number of layoffs declared over the past three months:
- Twitch: 35% of workforce
- Hasbro: 20% of workforce
- Spotify: 17% of workforce
- Levi’s: 15% of workforce
- Zerox: 15% of workforce
- Qualtrics: 14% of workforce
- Wayfair: 13% of workforce
- Duolingo: 10% of workforce
- Washington Post: 10% of workforce
- eBay: 9% of workforce
- PayPal: 9% of workforce
- Business Insider: 8% of workforce
- Charles Schwab: 6% of workforce
- Macy’s: 4% of workforce
- Blackrock: 3% of workforce
- Citigroup: 20,000 employees
- UPS: 12,000 employees
- Deutsche Bank: 3,500 employees
- Pixar: 1,300 employees
- Salesforce: 700 employees
- American Airlines: 650 employees
January 2024 saw a total of 82,000 layoffs, the second worst January since 2009.
Yet despite these layoffs and the huge disappointment in the number employed as reported in the Household Survey, the media wants everyone to believe the jobs market is strong.
The discrepancies in the data reported for both overall economic growth (GDP vs GDI) and total employment (Establishment vs Household Surveys vs declared layoffs), should at a minimum cause one to pause and require more information before concluding “all is well”!
The inconsistencies continue.
The S&P 500 Index closed at 4,959, up 1.4% for the week. The yield on the 10-year Treasury
Note fell to 4.03%. Oil prices decreased to $72 per barrel, and the national average price of gasoline according to AAA rose to $3.15 per gallon.
© 2023. This material was prepared by Bob Cremerius, CPA/PFS, of Prudent Financial, and does not necessarily represent the views of other presenting parties, nor their affiliates. This information should not be construed as investment, tax or legal advice. Past performance is not indicative of future performance. An index is unmanaged and one cannot invest directly in an index. Actual results, performance or achievements may differ materially from those expressed or implied. All information is believed to be from reliable sources; however we make no representation as to its completeness or accuracy.
Securities offered through First Heartland Capital, Inc., Member FINRA & SIPC. | Advisory Services offered through First Heartland Consultants, Inc. Prudent Financial is not affiliated with First Heartland Capital, Inc.

