Executive Summary
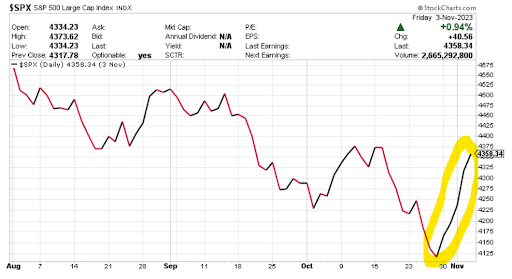
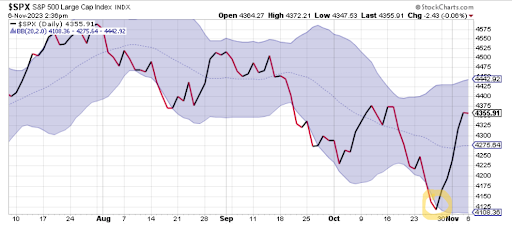
The S&P 500 Index rose five consecutive days last week, ending the week nearly 6% higher. However, note this move up is on the heels of a roughly three-month down move (see first graph). Simply speaking, technical market analysis of markets based on 20-day moving averages illustrates “overbought” and “oversold” conditions. Too far below the moving average is considered “oversold” (see 2nd graph yellow circle). The global economic situation did not drastically change last week, rather “oversold” conditions sparked stock buying, which triggered “short covering” (buying stock to cover short positions). Remember, speculation in markets due to future Fed interest rate moves, the jobs numbers and inflation rates does not change the broader economy, rather it impacts short-term market moves within bear and bull markets.
Please continue to The Details for more of my analysis.
“The stock market is filled with individuals who know the price of everything, but the value of nothing.”
–Phillip Fisher
The Details
Last week investors saw a tremendous jump in the stock market. This was a classic “oversold” bounce, fueled by short sellers buying stocks to cover their short positions. It is important to note that some of the strongest rallies in the stock market occur during bear markets. As shown in the graph of the S&P 500 Index below, after a roughly three-month downward move, the market shot up last week by almost 6%, with five consecutive up-days in the market.

“Oversold” and “overbought” conditions arise when the market is trading toward the bottom or top of a trading range. For example, the graph below shows the S&P 500 with a trading range highlighted in blue. (Geek’s note: The trading range, also called a Bollinger Band, shows volatility using two standard deviations from the 20-day simple moving average of the S&P 500.) When the market is trading at the bottom of the range, as highlighted in yellow below, technical traders call the market “oversold.” When the market is at the top of the range, it is considered “overbought.” This analysis by itself does not provide trading signals but does give an indication that a short-term reversal is likely. In the case of last week’s market movement, the S&P 500 touched the bottom of the range and short-term traders jumped into the market. When the market rose sharply, investors holding short positions were forced to cover their positions by buying stocks. These actions drove the market higher, forcing more short covering. By the end of the week, certain technical indicators were flashing “overbought” signals, indicating a reversal could take place this week.

The stock buying last week displayed a return to the “bad news is good news” days. A weak jobs report indicated the economy is truly breaking down. The Fed continues to maintain tight monetary policy with its Quantitative Tightening program and the possibility of further rate hikes, as they hope to bring inflation down to their target of 2%. Many investors saw the weak jobs numbers and jumped to the conclusion that this will keep the Fed from hiking rates further. This assumption motivated some investors to buy stocks and bonds as the stock market jumped and Treasury yields plummeted. In my opinion, this was a typical “jump to conclusions” move by traders which will soon reverse when more data is released.
Remember, these short-term movements are within the confines of a bear market. As the economy slows, corporate profits will suffer, and the jobs market will weaken further. As more layoffs occur, the recognition of a recession will become more accepted, and traders will fade stocks. This should lead to further drops in the stock market. Currently, investors are navel gazing at the Fed, hoping for some indication that they will change their monetary policies.
Last week’s short-term move was not based upon any hard data, which would indicate the economy is strengthening and inflation is falling. It was nothing more than a technical move based upon oversold conditions and a return to “bad news is good news,” hoping the Fed will halt interest rate hikes. The bear market continues.
The S&P 500 Index closed at 4,358, up 5.9% for the week. The yield on the 10-year Treasury
Note fell to 4.56%. Oil prices dropped to $81 per barrel, and the national average price of gasoline according to AAA decreased to $3.42 per gallon.
I always like to take a moment of my day to be grateful for the life I life and to think of new ways to help those around me.
With that being said, I’d like to invite you to join me in supporting St. Jude’s Children’s Research Hospital.
I am a St. Jude Hero! I have chosen to run for a reason bigger than myself by fundraising for the kids and families at St. Jude. I am training to cross the finish line on race day and with your donation, we can cross the fundraising finish line together because the money you donate helps find a cure for childhood cancer.
© 2023. This material was prepared by Bob Cremerius, CPA/PFS, of Prudent Financial, and does not necessarily represent the views of other presenting parties, nor their affiliates. This information should not be construed as investment, tax or legal advice. Past performance is not indicative of future performance. An index is unmanaged and one cannot invest directly in an index. Actual results, performance or achievements may differ materially from those expressed or implied. All information is believed to be from reliable sources; however we make no representation as to its completeness or accuracy.
Securities offered through First Heartland Capital, Inc., Member FINRA & SIPC. | Advisory Services offered through First Heartland Consultants, Inc. Prudent Financial is not affiliated with First Heartland Capital, Inc.

