Executive Summary
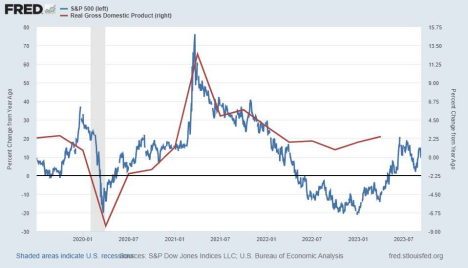
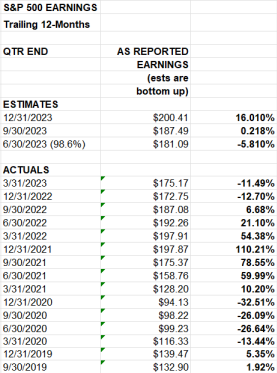
The Fed’s response to the 2008 Financial Crisis initiated programs which grew their balance sheet from $900 billion to $4.5 trillion by 2014. In 2018 the Fed began reversing course and reducing their balance sheet. However, by mid-2019 markets and the economy were showing weakness and they stopped. Using Real GDP as a representation of the economy and the S&P 500 for the market, one can look at the first graph as a visual to see what happened before COVID-19 to current. In response to COVID-19, the Fed and the Federal Government implemented massive programs to combat the effects of shutdowns. This unprecedented stimulus and QE sent the stock market, corporate profits, and the economy soaring. Massive inflation resulted, and the Fed began raising interest rates to rein it in. Corporate profits are suffering (second chart). With rising inflation, rising interest rates, falling corporate profits, and overall debt, the threat to the economy and markets is high. The Fed and government programs may change to delay a recession, but the ingredients seem baked in the cake.
Please continue to The Details for more of my analysis.
“It’s not true that life is one damn thing after another; it is one damn thing over and over.”
–Edna St. Vincent Millay
The Details
To understand the current state of the stock market and economy, let’s examine the S&P 500 Index, real (inflation-adjusted) GDP growth, and trailing 12-month, GAAP (Generally Accepted Accounting Principles) earnings for companies in the S&P 500 Index from mid-2019 to present. But first a little history. During the Financial Crisis in 2008, the Fed began their massive Quantitative Easing programs (QE), growing their balance sheet from around $900 billion to about $4.5 trillion by the end of 2014. In 2018, the Fed started letting bonds “roll-off” of their balance sheet at maturity (QT-Quantitative Tightening). However, with the economy and markets showing signs of weakness by mid-2019, the Fed halted their QT program. All of this was prior to any word of a pandemic. Notice in the first graph below, the blue line (percent change from a year ago in the S&P 500) rose sharply at the end of 2019 with the discontinuance of QT.
Shortly after came the arrival of COVID-19. Notice in the graph below, the economy (red line) and stock market (blue line) both plunged as the economy came to a stop. The second chart below shows S&P 500 net earnings falling off of a cliff during 2020. The Federal government’s response in conjunction with a return to QE by the Fed provided the largest ever infusion of “created” liquidity into the economy. The Fed’s balance sheet – already enormous due to the post-Financial Crisis QE programs – almost doubled again, growing to just under $9 trillion. This unprecedented stimulus and QE sent the stock market, corporate profits, and the economy soaring as shown in the charts below.
As I wrote at the time, it was apparent this would be a temporary “sugar-high” purely in response to such extraordinary Federal intervention. With the sugar-high wearing-off in 2021, the stock market and economy began to fall in 2022. Back in 2019, I wrote about the signs of a potential recession as the economy and corporate profits were weakening. The start of and response to COVID-19 delayed the ultimate arrival of the recession. Although a brief recession arrived during the pandemic, it was papered over by the Fed and Federal government.


Source: SPGlobal.com
The upcoming recession is now likely to be more damaging than it would have been in early 2020, absent the pandemic, because debt has grown tremendously. Also, the “unexpected” result of the unprecedented Federal action – inflation – is inflicting great pains on households and businesses. The response by the Fed has been to raise interest rates in an attempt to rein in inflation. Combining high debt with high interest rates has brought on a whole new slew of problems impacting the economy.
The stock market turned from bull market to bear market in January 2022. And, although it has experienced some strong “bear market rallies,” especially the most recent rally, the cycle has turned into a bear market. And the economy is either in recession or close to the onset of one. Like the end of all cycles, financial pundits deny reality and espouse the continuation of the previous cycle. For example, look at the chart of S&P 500 earnings above. Notice the trailing 12- month earnings numbers turned negative in 2022, yet the always optimistic pundits still show
estimated growth in earnings of 16% by the end of 2023. Of course, these numbers will be revised lower as fourth-quarter earnings season approaches.
Real GDP estimates for third-quarter 2023 are all over the board. The Atlanta Fed is forecasting a whopping 5.6% annual growth rate, while The Conference Board is estimating 1.3% growth, and the St. Louis Fed is still showing negative growth at -0.25%. And most estimates are for negative growth in the fourth quarter.
With many economic indicators at or near recessionary levels, and interest rates hurting households and businesses, I believe a recession is near and corporate earnings will disappoint by the end of the year. Absent a new Fed program to kick the can down the road further, and to compound existing problems, the stock market should continue to fall this year and into next year. From there it will depend upon the extent of the recession and the Federal response.
Former Merrill Lynch investment guru, Bob Farrell’s investing rule #8 (of 10) states, “Bear markets have three stages – sharp down, reflexive rebound, and a drawn-out fundamental downtrend.” The markets experienced a sharp downturn during 2022. This year markets illustrated the reflexive rebound. With the economy weakening and profits hit by a weak economy and high interest rates, it is possible the market is about to begin the drawn-out fundamental downtrend. The length and depth all depend upon the Federal response.
The S&P 500 Index closed at 4,457, down 1.3% for the week. The yield on the 10-year Treasury Note rose to 4.26%. Oil prices increased to $88 per barrel, and the national average price of gasoline according to AAA rose to $3.83 per gallon.
I always like to take a moment of my day to be grateful for the life I life and to think of new ways to help those around me.
With that being said, I’d like to invite you to join me in supporting St. Jude’s Children’s Research Hospital.
I am a St. Jude Hero! I have chosen to run for a reason bigger than myself by fundraising for the kids and families at St. Jude. I am training to cross the finish line on race day and with your donation, we can cross the fundraising finish line together because the money you donate helps find a cure for childhood cancer.
© 2023. This material was prepared by Bob Cremerius, CPA/PFS, of Prudent Financial, and does not necessarily represent the views of other presenting parties, nor their affiliates. This information should not be construed as investment, tax or legal advice. Past performance is not indicative of future performance. An index is unmanaged and one cannot invest directly in an index. Actual results, performance or achievements may differ materially from those expressed or implied. All information is believed to be from reliable sources; however we make no representation as to its completeness or accuracy.
Securities offered through First Heartland Capital, Inc., Member FINRA & SIPC. | Advisory Services offered through First Heartland Consultants, Inc. Prudent Financial is not affiliated with First Heartland Capital, Inc.

