Executive Summary
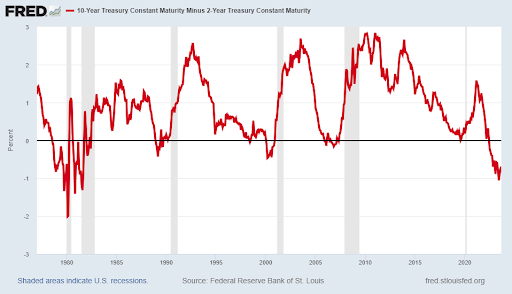
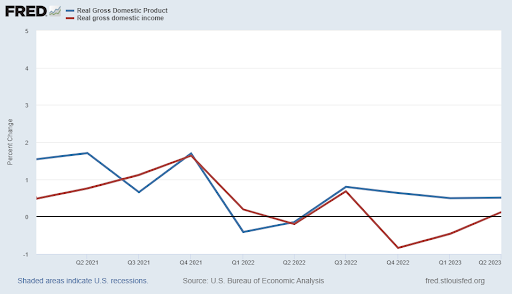
This week’s newsletter will be abbreviated as is the Labor Day work week. The inverted yield curve, which has preceded most recessions, seems to be indicating recession (see first graph). Two consecutive quarters of negative GDP is generally accepted as a recession. However, in 2022 we were told “this time is different”. Another indicator is GDI (Gross Domestic Income) which should track similar to GDP. Looking at the red line in the second graph shows GDI indicating more negative data than GDP. Will GDP or GDI be the better indicator?
Please continue to The Details for more of my analysis.
“Nothing so weakens a government as inflation.”
–J.K. Galbraith
The Details
On this abbreviated holiday week, I will provide a shorter than usual newsletter. This missive will provide food for thought, since we won’t definitively know the answer until after the fact. Many economic indicators have been warning of an impending recession for some time now. One of the most watched indicators is the inverted yield curve, where short term yields are higher than long term yields. As shown in the graph below, the yield curve has inverted before most prior recessions.

Despite many economic indicators suggesting the U.S. is in a recession, the National Bureau of Economic Research (NBER) has not officially declared a recession has begun. Last year Real Gross Domestic Product (GDP) indicated negative growth for two consecutive quarters; however, even though many consider that a litmus test for a recession, we were told “this time is different.” No recession was announced. Since then, GDP has jumped back to positive growth, thanks in large part to government spending. A perusal of prior cycles will indicate it is not unusual to have strong growth just prior to the start of a recession. Estimates of third quarter GDP growth suggest strong growth for the quarter. Even so, many financial pundits are calling for a recession to start in the fourth quarter.
GDP growth is the measure of economic activity based upon consumption, investment, government spending and net exports. GDI – Gross Domestic Income – is a measure of the economy based upon total income from all sectors. In theory the two measures should equal one another. However, because of the size and complexity of the economy, the two measures contain statistical discrepancies. Currently, GDI, unlike GDP, is indicating a possible recession. The fourth quarter 2022 and first quarter 2023 revealed negative real GDI growth. In the second quarter 2023, GDI was effectively flat.

So, which calculation is correct? Unfortunately, the answer won’t be revealed until after the fact. However, the preponderance of evidence combined with high and rising interest rates give weight to the result shown by the measure of GDI. Soon we will learn which indicator more accurately predicted a recession.
The S&P 500 Index closed at 4,516, up 2.5% for the week. The yield on the 10-year Treasury
Note fell to 4.17%. Oil prices increased to $86 per barrel, and the national average price of gasoline according to AAA dropped to $3.81 per gallon.
I always like to take a moment of my day to be grateful for the life I life and to think of new ways to help those around me.
With that being said, I’d like to invite you to join me in supporting St. Jude’s Children’s Research Hospital.
I am a St. Jude Hero! I have chosen to run for a reason bigger than myself by fundraising for the kids and families at St. Jude. I am training to cross the finish line on race day and with your donation, we can cross the fundraising finish line together because the money you donate helps find a cure for childhood cancer.
© 2023. This material was prepared by Bob Cremerius, CPA/PFS, of Prudent Financial, and does not necessarily represent the views of other presenting parties, nor their affiliates. This information should not be construed as investment, tax or legal advice. Past performance is not indicative of future performance. An index is unmanaged and one cannot invest directly in an index. Actual results, performance or achievements may differ materially from those expressed or implied. All information is believed to be from reliable sources; however we make no representation as to its completeness or accuracy.
Securities offered through First Heartland Capital, Inc., Member FINRA & SIPC. | Advisory Services offered through First Heartland Consultants, Inc. Prudent Financial is not affiliated with First Heartland Capital, Inc.

