Executive Summary
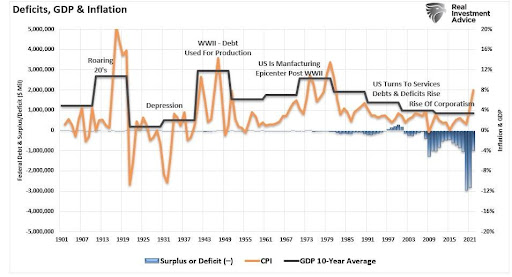
Fitch, one of the three largest credit rating agencies, recently downgraded the U.S. debt rating from AAA to AA+ because the debt-to-GDP ratio is projected to reach over 118% by 2025. This ratio of debt is way out of line of a AAA rating, which has a median of 39%. The Federal Government has been using deficit spending to combat the economic shocks of the Financial Crisis and the COVID pandemic. The first graph below shows the relationship between deficits, GDP & inflation. While deficits and inflation have increased significantly, GDP has remained low – only lower during the Great Depression years. With Federal debt approaching $33 trillion, interest expense has risen to $970 billion. In the event of a recession: Will they create more deficits? Will they raise interest rates to fight the resulting inflation?
Please continue to The Details for more of my analysis.
“Anyone who believes exponential growth can go on forever in a finite world is either a madman or an economist.”
–Kenneth E. Boulding
The Details
At the start of August, Fitch, one of the three largest rating agencies, downgraded the credit rating for the U.S. The following is from Fitch’s statement (via Lance Roberts at SimpleVisor Insights),
“Fitch Ratings has downgraded the United States of America’s Long-Term Foreign-Currency Issuer Default Rating (IDR) to ‘AA+’ from ‘AAA’. The Rating Watch Negative was removed and a Stable Outlook assigned. The Country Ceiling has been affirmed at ‘AAA’. […]
“The General Government debt-to-GDP ratio is projected to rise over the forecast period, reaching 118.4% by 2025. The debt ratio is over two-and-a-half times higher than the ‘AAA’ median of 39.3% of GDP and ‘AA’ median of 44.7% of GDP. Fitch’s longer-term projections forecast additional debt/GDP rises, increasing the vulnerability of the U.S. fiscal position to future economic shocks.”
Federal debt has been a growing problem for some time but has been exacerbated by the economic shocks of the Financial Crisis of 2007-2008, and more recently by the pandemic. It was not just the “economic shocks” but also the Federal response to such shocks. The responses are responsible for the current difficulties surrounding inflation and rising interest rates.
The graph below, prepared by Real Investment Advice, shows annual Federal surpluses and deficits in blue, inflation (CPI) in orange, and the 10-year average economic growth rate in black. Notice the average GDP growth rate has never been lower outside of the Great Depression years. Also, the years after the Financial Crisis illustrate the exponential growth in deficits, which only worsened during the pandemic.

As money was created to “solve” prior crises, the expected result – inflation – finally reared its ugly head. In attempts to gain control of inflation, the Fed has been raising interest rates at a record pace. The problem is the U.S. must pay these higher interest rates on its soaring debt balance. The current balance is $32.7 trillion and rapidly approaching $33 trillion.
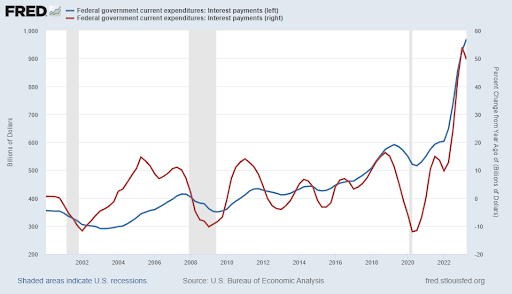
The graph below, prepared using the St. Louis Fed FRED database, shows the skyrocketing Federal interest payments in dollars (blue line). This number is presently $970 billion. Even more concerning is the rate of change in the interest expenditure. The red line below shows a year-over-year increase in interest expense of 50%!

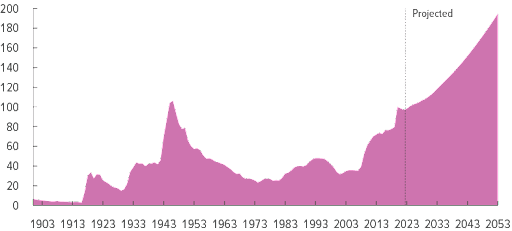
As the economy slows and recession fears abound, one has to wonder what the Federal government will do in response to any potential new crisis. The recipes of the past would dictate more government spending which could lead to higher inflation. Would the Fed increase rates further to tame this increase in inflation? How much higher can interest rates realistically climb with almost $33 trillion in debt outstanding, and future deficits projected to add trillions more. The graph below from the CBO (Congressional Budget Office) illustrates debt as a percentage of GDP continuing to soar. Their projections, absent any new economic shocks, show debt-to-GDP rising to almost 200% by 2053.

Just the cursory review of the debt situation presented above is enough to understand why Fitch downgraded the U.S. credit rating. The real question is, How can this situation be reversed? And if the U.S. is past the point of no return, when will the other credit rating agencies jump on board? How much higher can interest rates go? Not much.
The S&P 500 Index closed at 4,464, down 0.3% for the week. The yield on the 10-year Treasury
Note rose to 4.17%. Oil prices remained at $83 per barrel, and the national average price of gasoline according to AAA rose to $3.85 per gallon.
© 2023. This material was prepared by Bob Cremerius, CPA/PFS, of Prudent Financial, and does not necessarily represent the views of other presenting parties, nor their affiliates. This information should not be construed as investment, tax or legal advice. Past performance is not indicative of future performance. An index is unmanaged and one cannot invest directly in an index. Actual results, performance or achievements may differ materially from those expressed or implied. All information is believed to be from reliable sources; however we make no representation as to its completeness or accuracy.
Securities offered through First Heartland Capital, Inc., Member FINRA & SIPC. | Advisory Services offered through First Heartland Consultants, Inc. Prudent Financial is not affiliated with First Heartland Capital, Inc.

