Executive Summary
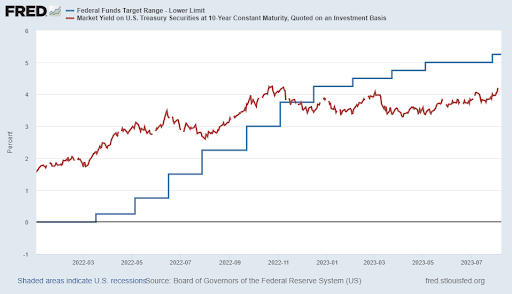
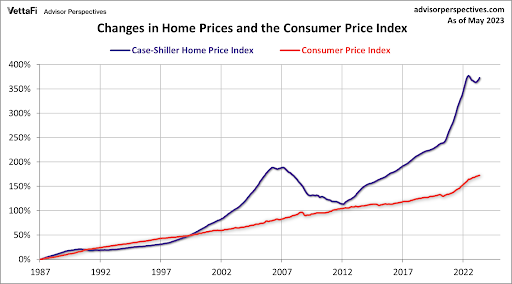
Since the Federal Reserve Bank raised the Federal Funds Rate to 5.25%, the 30-year fixed mortgage rate has jumped to 7.46% (see second graph) – over double the pre-pandemic rate. At the same time, home prices have only dropped between .9%-2.3% (3rd graph) according to the Case-Shiller Home Price Index. Typically, home prices track the consumer price index. However, prior to the Financial Crisis and currently, they have disconnected (4th graph). Although housing markets are considered local, one can see the current bubble in housing prices – making them unaffordable for many Americans. If mortgage rates stay this high, it means downward risk on home prices at some point.
Please continue to The Details for more of my analysis.
“It is a curious fact that although all booms are alike, all are different.”
–Edwin Lefevre
The Details
As a response to the surge in inflation in 2021, the Federal Reserve Bank (Fed) began raising the short-term Fed Funds Rate (FFR) in early 2022. Since then, the Fed has raised the FFR to 5.25%. At the same time, the yield on 10-Treasury Notes rose from around 1.6% to the current yield of about 4.1%.
According to Investopedia, as of August 7, 2023, the National average of mortgage interest rates for borrowers with a credit score of 700-760 and a 20% down payment are as follows:
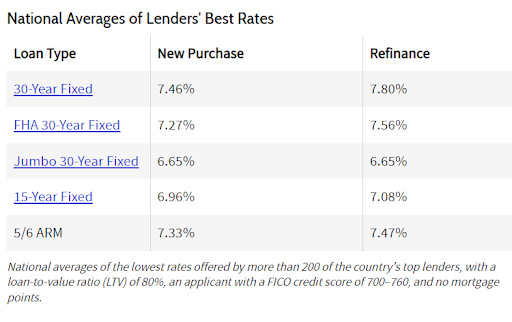
The current New Purchase 30-year mortgage rate is over double the rate just prior to the pandemic. How have such rates impacted the prices of homes for sale? As shown in the graph below from Advisor Perspectives, the National Index of prices is only down 0.9% from its high. Prices are down 1.6% versus the all-time high according to the S&P/Case Shiller 10-City Composite Index, and down 2.3% vs the 20-City Composite Index. These price drops are quite small considering the over doubling of mortgage rates.
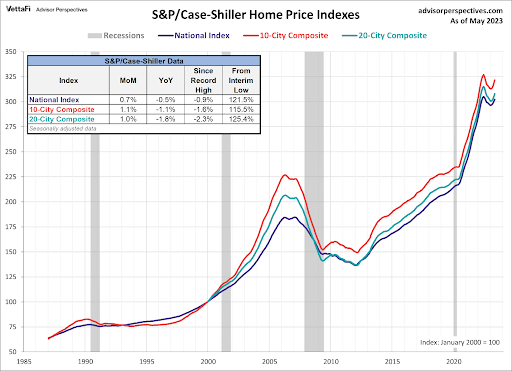
If home prices have only dropped slightly from their all-time high, are home prices overvalued? In a word, “Yes”! Over the long term, home prices have tended to track inflation. If home prices appreciated much above inflation, then buyers would not be able to afford to purchase a home. However, with rates held artificially low via over a decade of experimental monetary policy, home prices soared. The bubble in home prices is now greater than that witnessed prior to the Financial Crisis.
The graph below compares the Case-Shiller Home Price Index to the Consumer Price Index (CPI). Notice the gap now is much larger than the peak gap in 2006. And low mortgage rates are no longer around to “justify” such prices.
Another way to view this graph is by inflation-adjusting the S&P/Case-Shiller U.S. National Home Price Index. Using the theory espoused previously, that home prices should appreciate close to the rate of inflation, this graph should be relatively flat. However, during the real estate boom prior to the Financial Crisis, real (inflation-adjusted) home prices jumped 55% to 155.4 versus the 1982 index base of 100. After the real estate bust and Financial Crisis, prices fell back almost to the real index base of 100, hitting 100.7.
Then, interest rates fell, and the second real estate bubble began. Accelerated by actions during the pandemic and mortgage rates under 3%, prices skyrocketed to 175.7 or almost 75% above the index base. Even with the slight correction since rates began to rise, the index remains 66.7% above the February 2012 level.
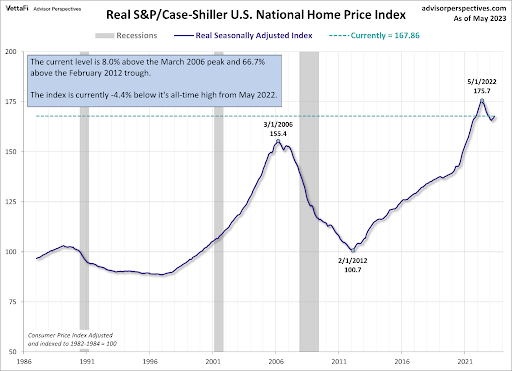
Of course, the thing about real estate is that it is all local. Some locations have corrected more than others. Some areas will drop considerably from current prices, while others may only see a mild correction. Nevertheless, based upon the theory of home prices versus inflation – backed by years of data prior to Real Estate Bubble #1 – home prices are now about 66% overvalued. How far prices will drop, and in which areas of the country will only be known after the fact. But if mortgage rates remain high, there is severe risk of large drops in home prices.
Home prices tend to lag other economic data. Notice that prices in Real Estate Bubble #1, which began deflating in 2006, did not bottom-out until 2012. I believe high mortgage rates will have a dramatic impact on home prices in the near future.
The S&P 500 Index closed at 4,478, down 2.3% for the week. The yield on the 10-year Treasury
Note rose to 4.06%. Oil prices increased to $83 per barrel, and the national average price of gasoline according to AAA rose to $3.83 per gallon.
© 2023. This material was prepared by Bob Cremerius, CPA/PFS, of Prudent Financial, and does not necessarily represent the views of other presenting parties, nor their affiliates. This information should not be construed as investment, tax or legal advice. Past performance is not indicative of future performance. An index is unmanaged and one cannot invest directly in an index. Actual results, performance or achievements may differ materially from those expressed or implied. All information is believed to be from reliable sources; however we make no representation as to its completeness or accuracy.
Securities offered through First Heartland Capital, Inc., Member FINRA & SIPC. | Advisory Services offered through First Heartland Consultants, Inc. Prudent Financial is not affiliated with First Heartland Capital, Inc.
