Executive Summary
John Hussman, Ph.D., economist, market analyst and fund manager, provides some of the best market analyses in the industry. He is renowned for using actual historical occurrences in assessing the validity of valuation methodologies and identifying market syndromes. He gained recognition by accurately predicting the depths of the 2000-2002 and 2007-2009 market collapses. Unlike many pundits who ignore fundamentals, Dr. Hussman examines both fundamental and technical analyses. In this missive, I will provide excerpts from his recent Hussman Market Comment entitled, “Air Pockets, Free Falls, and More Cowbell” to provide a detailed picture of the present state of the stock market and possible near-term outcomes. For those who would like to view the Comment in its entirety, here is a link https://www.hussmanfunds.com/comment/mc230724/
Please continue to The Details for more of my analysis.
“Seriousness is flagged by the language that you use. I’ve always tried to make a big difference, but the difference is often wasted because people don’t remember what you sounded like when you were serious. This difference I’m trying to make is just the routine ‘the market is expensive,’ and the significance. The significance is three bubbles. This is serious.”
–Jeremy Grantham, GMO, Livewire Markets Interview, May 2021
The Details
John Hussman, Ph.D., economist, market analyst and fund manager, provides some of the best market analyses in the industry. He is renowned for using actual historical occurrences in assessing the validity of valuation methodologies and identifying market syndromes. He gained recognition by accurately predicting the depths of the 2000-2002 and 2007-2009 market collapses. Unlike many pundits who ignore fundamentals, Dr. Hussman examines both fundamental and technical analyses. In this missive, I will provide excerpts from his recent Hussman Market Comment entitled, “Air Pockets, Free Falls, and More Cowbell” to provide a detailed picture of the present state of the stock market and possible near term outcomes. For those who would like to view the Comment in its entirety, you may do so here.
There is a particular “setup” that we’ve historically found to be associated with abrupt “air pockets” and “free falls” in the S&P 500. It combines hostile conditions in all three features most central to our investment discipline: rich valuations, unfavorable market internals, and extreme overextension. The last time we observed this combination to a similar degree was in November 2021, shortly before the S&P 500 lost a quarter of its value. The S&P 500 remains lower than it was then. Despite enthusiasm about the market rebound since October, I remain convinced that this initial market loss will prove to be a small opening act in the collapse of the most extreme yield-seeking speculative bubble in U.S. history.
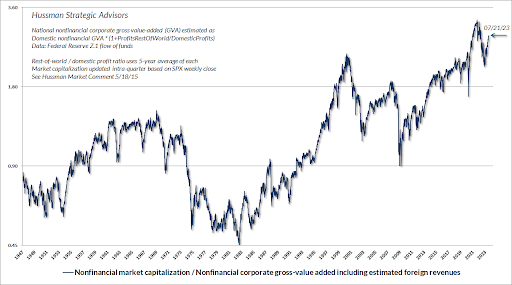
The present combination of historically rich valuations, unfavorable internals, and extreme overextension places our market return/risk estimates – near term, intermediate, full-cycle, and even 10-12 year, at the most negative extremes we define. [ . . . ] At present, our best measures of valuation are more extreme than at any point in history prior to December 2020, with the exception of a few weeks surrounding the 1929 market peak. This is what Wall Street is calling a “new bull market.”
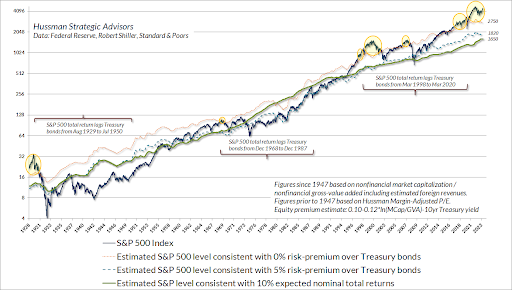
[ . . . ] The chart below presents the same valuation information in the form of S&P 500 levels. The green line in the chart below is the level of the S&P 500 that we would associate with historically “run-of-the-mill” expected S&P 500 total returns of 10% annually. The blue dashed line shows the level of the S&P 500 that we would associate with a historically average 5% expected total return over-and-above prevailing 10-year Treasury bond yields. The orange dotted line shows the level of the S&P 500 that we would associate with a zero “risk-premium” over-and-above prevailing 10-year Treasury bond yields. The yellow bubbles show points where the S&P 500 was at valuations that implied a “negative risk premium” relative to bonds. I’ve also added several brackets showing that the S&P 500 did, in fact, lag bonds following these points, typically for about 20 years. I expect the current instance to be no different.
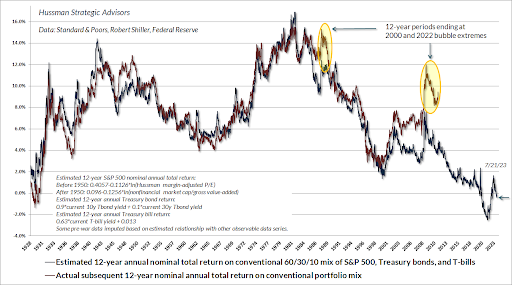
[ . . . ] At present, the valuation extremes we observe imply that a -64% loss in the S&P 500 would be required to restore run-of-the-mill long-term prospective returns. I know. That sounds preposterous. Then again, as the chart below suggests, I’ve become used to making seemingly preposterous risk estimates at bubble peaks, having correctly anticipated the depth of the 2000-2002 and 2007-2009 collapses, as well as projecting an 83% loss in technology stocks in March 2000 (the Nasdaq 100 went on to lose an implausibly precise 83%). [ . . . ] The chart below shows our estimate of likely 12-year average annual nominal total returns for a conventional “passive” portfolio allocation invested 60% in the S&P 500, 30% in Treasury bonds, and 10% in Treasury bills. The red line shows actual subsequent 12-year total returns for this allocation.
At present, our estimate of 12-year returns for a conventional passive portfolio stands at -0.4%, below the estimate based on data from the 1929 market peak, and indeed, below every estimate in history prior to July 2020. For more than a decade, zero interest rate policy encouraged investors to drive securities to valuation extremes that now imply more than a decade of zero long-term returns as well. Now comes the hard part.
[ . . . ] Over the past four decades, I’ve developed scores of interesting “syndromes” and relationships, many that I’ve discussed in these market comments. A subset of these capture features of “overextension” and “compression” that occur at major market extremes.
The chart below shows one such syndrome that emerged in mid-April as the S&P 500 advanced above 4400, and again last week, which I consider part of the same overextended advance. The criteria are intended to capture a certain “relentlessness” of speculation that often precedes abrupt market losses. This particular syndrome is among several that I monitor to identify speculative “blowoffs.” [ . . . ] The bars show the largest advance and deepest decline in the S&P 500 over the 15 trading days following each instance. Not a forecast – just a regularity.
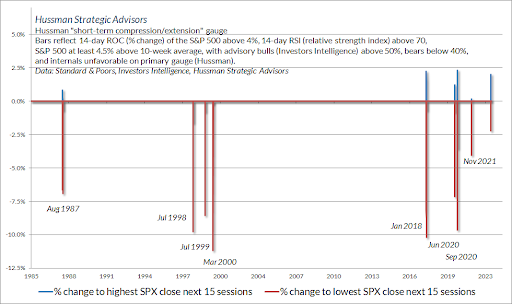
Notice that the market losses that resolve extreme overextension are not just short-term events. Combinations of rich valuations, unfavorable internals, and extreme overextension like these often occur at or near important cyclical market peaks. The potential for a near-term “air pocket” or “free fall” isn’t a forecast so much as a regularity that should not be ruled out. Likewise, with valuations again higher than at any point in history prior to December 2020, with the exception of several weeks surrounding the 1929 peak, the potential for a much steeper follow-through should be taken seriously. Even passive investors should examine their exposures carefully, and rebalance their portfolios to reflect their actual level of risk tolerance.
The S&P 500 Index closed at 4,536, up 0.7% for the week. The yield on the 10-year Treasury
Note fell to 3.79%. Oil prices increased to $77 per barrel, and the national average price of gasoline according to AAA rose to $3.59 per gallon.
© 2023. This material was prepared by Bob Cremerius, CPA/PFS, of Prudent Financial, and does not necessarily represent the views of other presenting parties, nor their affiliates. This information should not be construed as investment, tax or legal advice. Past performance is not indicative of future performance. An index is unmanaged and one cannot invest directly in an index. Actual results, performance or achievements may differ materially from those expressed or implied. All information is believed to be from reliable sources; however we make no representation as to its completeness or accuracy.
Securities offered through First Heartland Capital, Inc., Member FINRA & SIPC. | Advisory Services offered through First Heartland Consultants, Inc. Prudent Financial is not affiliated with First Heartland Capital, Inc.
