Executive Summary
The Fed is now implementing Quantitative Tightening (QT), thereby reducing the size of their balance sheet. They are also increasing interest rates, which will reduce liquidity through a drop in loan demand. Loan demand will be hurt both by higher interest rates as well as by the tightening of lending standards by banks concerned about making bad loans in a weakening economy. Some analysts believe inflation could rear its head again, pointing to a recent turn back up in the Money Supply (M2) combined with a rise in the velocity of M2. Please proceed to The Details to see graphs illustrating these points and to determine the conclusion resulting from the drain in liquidity.
Please continue to The Details for more of my analysis.
“Once a boom is well started, it cannot be arrested. It can only be collapsed.”
–John Kenneth Galbraith
The Details
The entire previous bull market, beginning after the Financial Crisis ending in 2009, was fueled by the Federal Reserve Bank’s (Fed’s) creation of liquidity through a massive increase in their balance sheet through the various Quantitative Easing (QE) programs, whereby they purchased Treasury and Agency securities with “created” funds (reserves). Additional liquidity was generated by new lending spurred by the Fed’s zero interest rate policy. The result of these unprecedented liquidity injections was the inflation of the largest bubble in stocks in the history of the stock market. The bull market ended in 2021. The start of 2022 saw the beginning of a new bear market. The bear market is needed to remove the excesses built into the prices of stocks during the liquidity-fueled bull market.
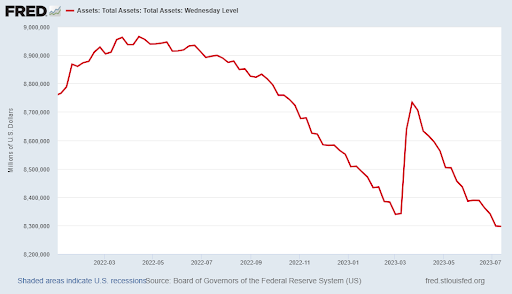
The Fed is now implementing Quantitative Tightening (QT), thereby reducing the size of their balance sheet. This reduction in liquidity is being accomplished by allowing maturing bonds to roll off of the balance sheet without replacing them. The graph of the Fed’s balance sheet below shows the reduction in assets owned. Notice the surge in assets in March 2023. This was attributable to the Fed’s emergency lending program, set up to save banks as two large banks, SVB and Signature Bank, failed. Currently, the asset level has dropped below the level prior to these bank failures.
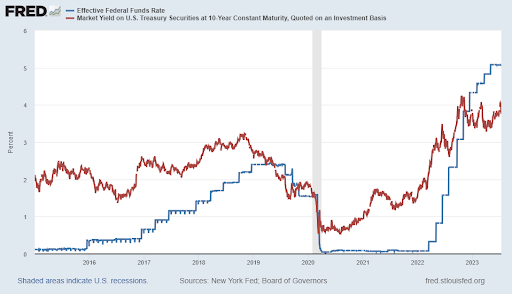
In addition to QT, the Fed has been raising the short-term Fed Funds Rate, in blue in the graph below. Raising the Fed Funds Rate was meant to combat inflation which was caused by the Fed’s use of QE to fund incredible Federal deficits. This rapid rise in the Fed Funds Rate pulled the yield on the 10-year Treasury Note higher as seen in red in the graph below.
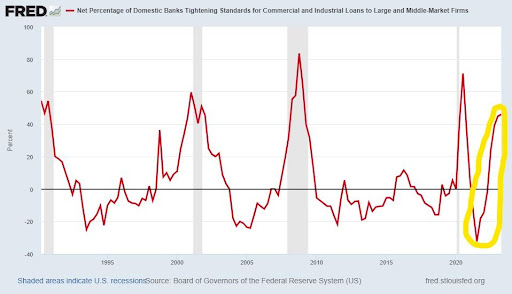
The increase in interest rates will reduce liquidity due to a drop in new loans. Loan demand will be hurt both by higher interest rates as well as by the tightening of lending standards by banks concerned about making bad loans in a weakening economy. Notice the dramatic rise in the percentage of banks tightening lending standards on commercial and industrial loans to large and middle-market firms in the chart below.
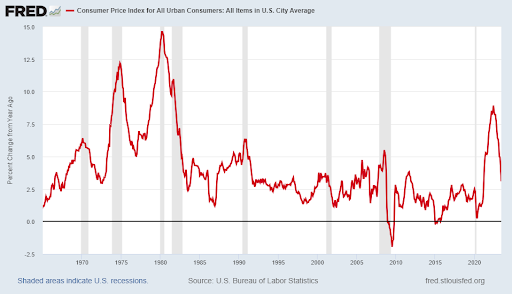
The weakening economy has resulted in lower demand for goods allowing for a reduction in the rate of inflation as measured by the CPI. The drop in the CPI was also due to a decrease in oil prices. Many pundits believe that inflation is no longer a problem and want the Fed to stop raising rates. In the 1970’s, inflation came in several waves. There are other analysts today who believe that the drop in inflation is over, and expect another wave of higher inflation. This could be fueled by higher wage inflation, a rise in oil prices and the impact of base effects.
Analysts that believe inflation could rear its head again point to a recent turn higher in the Money Supply (M2) combined with a rise in the velocity of M2. Velocity represents the turnover of a dollar during a year. A rising Money Supply and increased velocity could push prices higher.
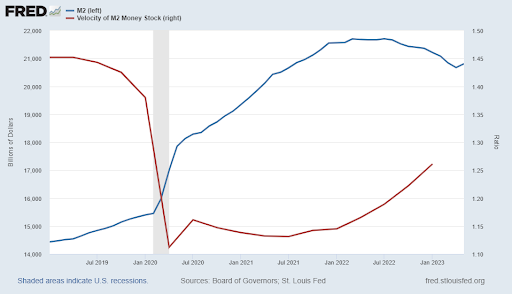
Soon it will be determined if inflation continues to decrease or if it has bottomed out and is ready to surge higher. In either case, there is no doubt that overall liquidity is decreasing. If increasing liquidity and zero interest rates pushed stock prices to the stratosphere, then it only makes sense that falling liquidity and rising interest rates in a weakening domestic and global economy should lead to a drastic drop in stock prices. Reasonable valuations remain far below current levels. The current bear market rally should end soon, and the next leg down could be significant.
The drain in liquidity, which will increase further with the resumption of student loan payments in October, could lead to an end to the current bear market rally and continuation of the bear market.
The S&P 500 Index closed at 4,505, up 2.4% for the week. The yield on the 10-year Treasury
Note fell to 3.82%. Oil prices increased to $75 per barrel, and the national average price of gasoline according to AAA rose to $3.56 per gallon.
© 2023. This material was prepared by Bob Cremerius, CPA/PFS, of Prudent Financial, and does not necessarily represent the views of other presenting parties, nor their affiliates. This information should not be construed as investment, tax or legal advice. Past performance is not indicative of future performance. An index is unmanaged and one cannot invest directly in an index. Actual results, performance or achievements may differ materially from those expressed or implied. All information is believed to be from reliable sources; however we make no representation as to its completeness or accuracy.
Securities offered through First Heartland Capital, Inc., Member FINRA & SIPC. | Advisory Services offered through First Heartland Consultants, Inc. Prudent Financial is not affiliated with First Heartland Capital, Inc.

